Marketing eel
There are numerous markets for eel products, including human consumption, fish bait, aquarium and fish feed markets. Internationally, market prices for cultured eels and eel products vary with species, country, product type and quality. The principal markets for eels are in Japan and Europe. However, the eel trade is unusual in many respects, because eels and eel products are consumed at all stages of their life cycle – e.g. as jellied eels (a glass eel product) and as smoked eel (a yellow or silver eel product).
Eels of all sizes are supplied to Oriental markets and are considered a delicacy. Suppliers to this market are willing to pay “top dollar” for adult eels and exorbitant prices for glass eels destined for consumption and/or grow-out.
The market for glass eels for direct human consumption is one of the main competitive problems affecting the availability of eel “seed” for capture-based aquaculture, since it forces the prices of glass eels upwards. Seed costs can be as much as 50 percent of the total production costs and in future could limit the profitability of the eel farming industry. For example, American glass eel prices in the USA rose over 500 percent between 1994 and 1998. In the past 20 years prices for live glass eels have been as high as US$ 2 200/kg, and this lucrative new market potential has been attractive to many countries, triggering a global eel industry. The market is not quite so lucrative now, due to the recent slump in the Asian economies and a slight recovery of native eel stocks (Tibbetts 2001).
The price of glass eels reached US$ 9 000/lb (US$ 19 845/kg) in China in 1996 (Anonymous 1996). Data on quantities and market prices vary widely from country to country, and even within the same country.
The number of glass eels per kilogram varies according to the species:
? Anguilla anguilla – the count is between 2 800 and 4 000 pieces/kg. Generally the glass eels are larger at the start of the season. The average annual count would be 3 200 pieces/kg.
? Anguilla japonica and Anguilla rostrata – the number of pieces per kilogram is considerably higher than Anguilla anguilla, namely between 5 000 and 6 000 pieces per kilo (www.glasseel.com).
One regional market for eels is Europe. Direct consumption of glass eels (e.g. in Spain, Italy and Portugal) is reported to be relatively low and, presumably, prices are lower for these glass eels than for those destined for stocking purposes. In Denmark this market is not a price leader, and the development here is not a threat to the same extent as the overseas market (Frost et al. 2000).
Glass eels are eaten raw or are fried in oil much like onion rings. Adult eels are smoked (continental Europe), jellied and stewed (London method), and, primarily, processed as “kabayaki”. Over 70 percent of global production is for the Japanese “kabayaki” market. “Kabayaki” is a style of serving, where eels of around 150-200 g are butterflied, placed on skewers, basted (marinated) in a thick soy based sauce, and steamed or grilled. More than 90 percent of eels consumed in Japan are served this way, with eels being the most widely consumed freshwater fish in Japan. As of July 2001, the market price for live eels averaged
US$ 12.50/kg (Tibbetts 2001). In restaurants in Japan, where eels are considered a healthy food, an eel dish can cost between US$ 20 and US$ 32/kg. The latter price represent the value of “futo”, what the Japanese call eels weighing 250-500 g (www.bangkokpost.net/education/ site2000/ptdc1500.htm).
After harvesting, eels are rapidly sorted into different sizes. Japanese eels reach 100-200 g after one year, and Japanese consumers prefer sizes of 120-150 g or 160-250 g, depending on the region. European markets prefer larger sizes of around 250 g, so Japanese eels of this size, not consumed in Japan, are generally exported to Europe.
Although global eel aquaculture production expanded from 1990 to 2000, the economic value has decreased. It peaked in 1994-1995 at US$ 1.4 billion and decreased to US$ 975 million in 2000 (Figure 32). However, FAO data does not include the value of around 50 000 tonnes of European eels that are produced annually in China.
Asia was at the top producer in 2000 with a production of US$ 889 million, followed by Europe with a production valued US$ 85 million. The production of eels by aquaculture by developing countries was valued US$ 569 million in 2000 and accounted for 58 percent of the global production value. China was the leading country with a value of US$ 289 million. In the same year, the farmed output of industrial countries was valued at US$ 405 million (Japan = US$ 320 million). Together, China and Japan accounted for 63 percent of the total value.
The value of European eels cultured in Europe remained fairly steady from 1991 to 2000 at about US$ 80 million (Figure 33). The European eels produced in China are not included in FAO data.
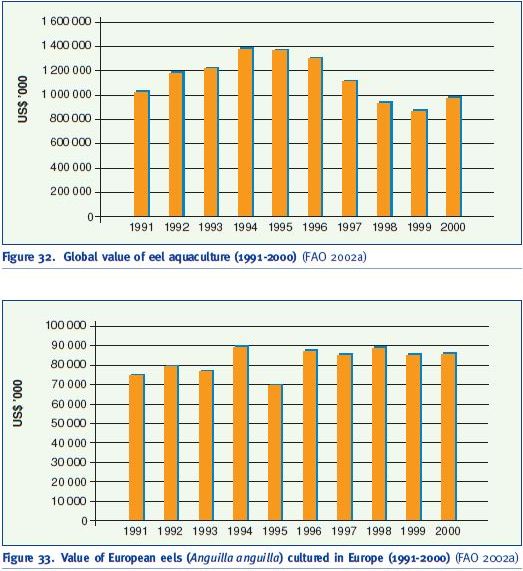
Figure 32. Global value of eel aquaculture (1991-2000) (FAO 2002a)
Figure 33. Value of European eels (Anguilla anguilla) cultured in Europe (1991-2000) (FAO 2002a)
The leading European producer in 2000 was the Netherlands, followed by Denmark and Italy (Table 19).
The trend in the value of the other important commercial species – Japanese eels (A. japonica), produced only in Asia, increased between 1991 and 1994/95 but then declined to a lower level in 2000 than in 1991 (Figure 34). In 2000, the leading producer was Japan, followed by China (Table 20).
The annual production of Japanese eels in Taiwan Province of China generally declined during the decade 1991-2000, with a peak of nearly 56 000 tonnes in 1991 and a trough of under 17 000 in 1999, rising again to about 30,000 tonnes in 2000, and the value fell from US$ 414 million in 1991 to US$ 229 million in 2000 (Fishstat Plus 2002). In addition to exporting eels for foreign exchange earnings, eels are also a popular seafood in the domestic market of Taiwan Province of China. This domestic market is growing rapidly and eel aquaculture is an undoubtedly a highly
Table 19. Production of European eels (Anguilla anguilla) by country in 2000 (FAO Fishstat Plus 2002)
Country Value (US$ ’000)
Netherlands 31 006
Denmark 24 066
Italy 18 079
Spain 3 699
Greece 3 090
Sweden 1 593
Germany 1 494
Belgium 825
France 525
Macedonia 450
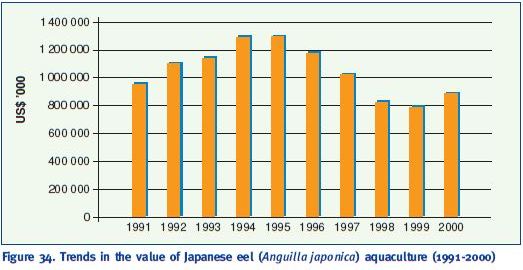
Figure 34. Trends in the value of Japanese eel (Anguilla japonica) aquaculture (1991-2000) (FAO 2002a)
Table 20. Japanese eel (Anguilla japonica) aquaculture production value by country in 2000 (FAO Fishstat Plus 2002)
Country Value (US$ ’000) in 2000
Japan 320 769
China 289 332
Taiwan Province of China 229 483
Republic of Korea 30 647
Malaysia 14 861
lucrative and profitable industry. The main export market for Taiwan Province of China is Japan, which takes up to 90 percent of its eel exports (www.american.edu/projects/mandala/TED/ eelfarm.htm).
In other Asian countries, eels are regarded as an “actively energetic” animal, and they have been associated for centuries with imparting strength and energy to humans (Wu 1999). This traditional thinking by Japanese and people from Taiwan Province of China, especially men, has led to their consuming eels in order to energize themselves and to pursue power. In particular, they believe that eels may help to improve or increase their sexual prowess.
The annual consumption of eels in Thailand is about 300 tonnes (www.bangkokpost.net/education/ site2000/ptdc1500.htm), of which 20 tonnes comes from an eel farm in Chacheongsao, with the rest being imported as “kabayaki” from Taiwan Province of China and Japan. Eels can fetch as much as US$ 32/kg, twice the price of good-quality shrimp (www.bangkokpost.net/education/ site2000/ptdc1500.htm).
Most of the Australian production is exported to European (Germany, Netherlands) and Asian markets (Hong Kong, Taiwan Province of China and Japan) as adults (>1 kg) as fresh, chilled or frozen whole fish. The “kabayaki” markets prefer eels weighing 200 g and Australian short-fin eels can be grown to this size in 12 to 18 months. A. australis closely resembles the Japanese eel A. japonica, in both appearance and taste.
The Japanese prefer eels that are uniform in colour, so the potential for A. australis in this market is high. As such, the short-fin eel is well accepted there and attracts similar prices to A. japonica, averaging around US$ 10-15/kg at the farm gate (live) when sold to Japan. The farm gate prices for short-fin eels that are destined to be sold to China are much lower (US$ 3-4/kg). There is potential for Australian producers to export all of their short-fin eel production to Japanese markets. Despite the high price paid for “kabayaki” eels, marketing of large eels (up to 5 kg each) into alternative markets may be equally if better in terms of financial returns (www.fisheries.nsw.gov.au/aquaculture/freshwater/eels.htm).
While there have been fluctuations in eel markets for years, it was not until the mid-1990s that eel prices began skyrocketing due to enhanced demand and dwindling supplies. One report shows that the estimated value of glass eels rose over 500 percent between 1994 and 1998 (www.ecoscope.com/eelnews.htm).
Eels are traded globally (import/export) in canned, frozen, smoked, fresh or chilled forms; live elvers and eels are also traded. FAO data does not report processed eels such as “kabayaki”, which account for most of eel trade in the Japan (at least 60 000-80 000 tonnes imported every year) and Japanese consumption. FAO data shows that global import volumes increased from more than 74 100 tonnes in 1990 to over 103 000 tonnes in 1999 (Figure 35); around 62 000 tonnes of this comprized canned river eels.
In 1999, 103 617 tonnes of eels were imported globally, mainly by Asia (84 904 tonnes), Europe (17 167 tonnes) and North America (1 532 tonnes). The lead importing country was Japan (Figure 36), with more than 68 300 tonnes (56 717 tonnes canned river eels and over 11 600 tonnes of live eels and elvers), followed by Taiwan Province of China, whose imports were mostly frozen eels.
The most imported eel commodity in 1999 was canned river eels, with a total of 62 279 tonnes (Japan 56 717 tonnes, Austria 5 094 tonnes, Taiwan Province of China 447 tonnes, etc.), followed by live elvers and eels (26 528 tonnes). Frozen eel imports were 12 856 tonnes (Taiwan Province of China 9 402 tonnes, USA 702 tonnes, Germany 691 tonnes, etc.). Fresh or chilled eel imports were 1 675 tonnes (Spain 565 tonnes, Germany 440 tonnes, Denmark 158 tonnes, Belgium 100 tonnes,
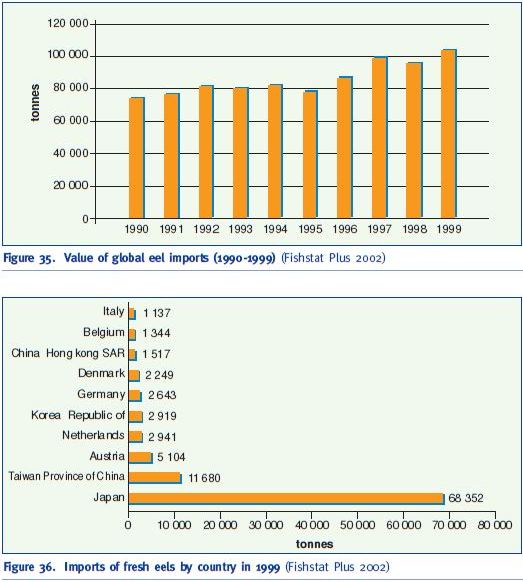
Figure 35. Value of global eel imports (1990-1999) (Fishstat Plus 2002)
Figure 36. Imports of fresh eels by country in 1999 (Fishstat Plus 2002)
etc.) and smoked eels 279 tonnes (Denmark 102 tonnes, Belgium 62 tonnes, Germany 60 tonnes, etc.).
In 1999, total import value of eel products was over US$ 1 billion, the leading country being Japan (Figure 37), followed at a far lower scale by China and the Republic of Korea.
Eel commodities are also exported; the trends 1990 to 1999 are shown in Figure 38. In 1999, 39 016 tonnes were exported (valued at US$ 362 million), with Asia being the leading continent (21 790 tonnes), followed by Europe with 14 496 tonnes, and Oceania with 1 264 tonnes.
In 1999, the leading exporting country was China with 9 149 tonnes, followed by Taiwan Province of China. Third was the leading European exporter of eels, Denmark (Table 21). However, other sources show that China exports far more eels than the FAO data indicate, some 120 000 tonnes in 2001. The top ten exporters of eels by value are shown in Table 22.
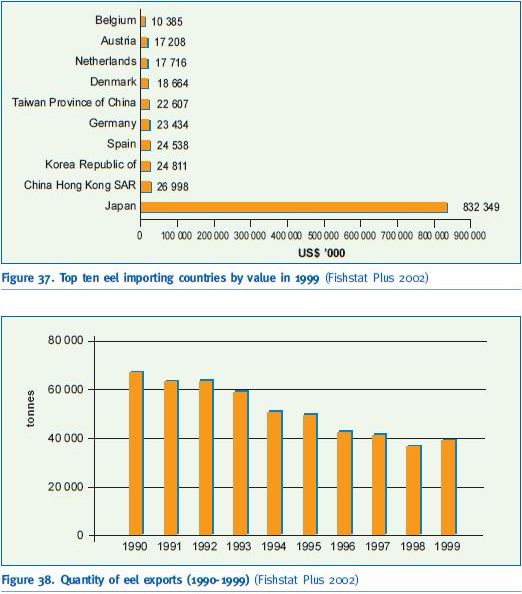
Figure 37. Top ten eel importing countries by value in 1999 (Fishstat Plus 2002)
Figure 38. Quantity of eel exports (1990-1999) (Fishstat Plus 2002)
From 1990 to 1999, the production of eel commodities, mainly consisting of canned river eels, peaked in 1994 and then declined until 1999 (Figure 39). The total in 1999 was 27 640 tonnes, mainly canned river eels; China being the leader (25 000 tonnes). China was also the lead country for frozen eel production (548 tonnes), with Denmark (354 tonnes) second and Canada (331 tonnes) third. Processed eels such as “kabayaki” are not included in FAO data, even though this is the main commodity for which eel capture-based aquaculture production is destined.
The information in Tables 23-28 has been extracted from Japanese monthly trade data (www.wtco.osakawtc.or.jp/e/market/item/eels.html). Japan, as a leading market for eel products, can be considered as an example of the commodity trade in eels and eel products (data source: Statistics from Japan Trade Monthly). The totals for imports of fresh and processed eels over the past few years are shown in Table 23, while the type of products imported in 1998 are given in Table 24.
Table 21. Top ten exporters of eels by volume in 1999 (Fishstat Plus 2002)
Country Quantity (tonnes)
China 9 149
Taiwan Province of China 8 763
Denmark 5 780
Netherlands 2 079
Sweden 1 900
India 1 843
United Kingdom 1 047
Italy 1 043
New Zealand 840
Canada 796
Table 22. Top ten exporters of eels by value in 1999 (Fishstat Plus 2002)
Country Value (US$ ’000)
Taiwan Province of China 117 712
China 57 297
Denmark 42 110
France 36 692
Netherlands 18 721
United Kingdom 15 079
Spain 13 745
Japan 10 200
Italy 8 741
Sweden 6 474
As Table 24 shows, processed eels made up 75 percent of imports in 1998. The main sources, types and values of Japanese eel imports are shown in Tables 25 and 26.
The Japan Times reported that Japan imported 133 200 tonnes of eels in 2000, 99.9 percent of which came from China and Taiwan Province of China (www.japantimes.co.jp/cgi-bin/ getarticle.pl5?nb20010706a1.htm). The Japanese consume more than 110 000 tonnes of eels per year, while domestic production is only about 30 000 tonnes (www.dpi.qld.gov.au/fishweb/ 2691.html). Of the eels consumed, 60 percent come from China, and another 20 percent from Taiwan Province of China. Chinese producers charge about 600 Yen/kg compared to domestic farms that sell eels for 1 000 Yen/kg or more.
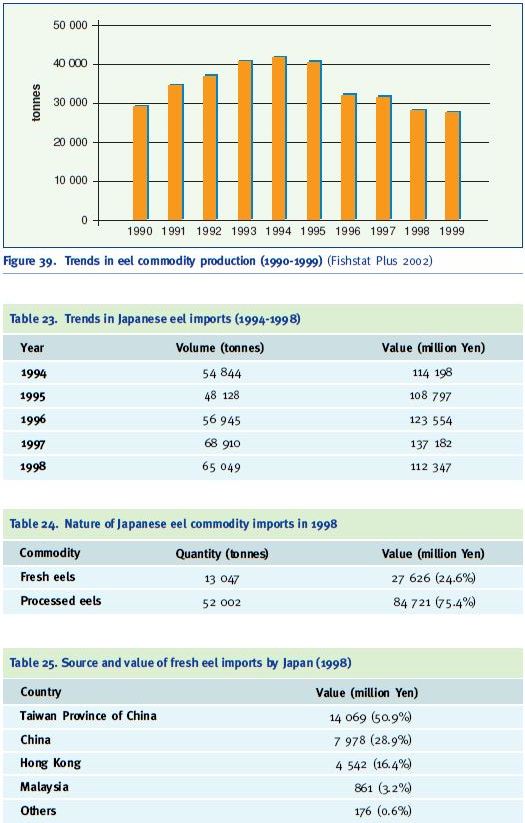
Figure 39. Trends in eel commodity production (1990-1999) (Fishstat Plus 2002) Table 23. Trends in Japanese eel imports (1994-1998)
Table 24. Nature of Japanese eel commodity imports in 1998
Table 25. Source and value of fresh eel imports by Japan (1998)
Table 26. Source and value of processed eel imports by Japan (1998)
Country Value (million Yen)
China 76 746 (90.6%)
Taiwan Province of China 5 566 (6.6%)
Malaysia 1 645 (1.9%)
Others 764 (0.9%)
Japan also exports eels, but only in limited quantities. Fresh eel exports in 1997 and 1998 are shown in Table 27 and the main destinations in Table 28. These exports appear to be of wild Japanese eels, imported directly by Japanese restaurants in Taiwan Province of China and Hong Kong.
Table 27. Eel exports by Japan
Year Value (million Yen)
1997 138
1998 119
Table 28. Destination of eel exports by Japan 1997

In Japan, eel businesses and other users are increasingly looking for greater simplicity (e.g. being able to cook unseasoned and seasoned grilled eels in individual packs suitable for microwave ovens or boiling water) and cheaper, more dependable supplies. Demand is also shifting from fresh to processed eels as a result of advances in processing, and imports of processed eel from countries such as China (www.wtco.osakawtc.or.jp/e/market/item/eels.html). Although imports from China and Taiwan Province of China are mainly of Japanese eels (the same species that is captured and cultured in Japan), the use of cheaper European eels for processed is increasing. The profitability of farming European eels could be increased by accessing these markets. Imports of glass eels for farming are not subject to import duty, but duties on fresh eels and processed eels are currently 5 percent and 9.6 percent respectively, when used for direct consumption.
Very few eels are sold live to consumers in Japan; 91 percent of final sales are in the form of processed products. From the farm to the processor, live eels pass through a complex distribution network. Three main problems threaten the Japanese eel industry in the next decade: strong competition from Taiwan Province of China and Chinese products; a new gill disease of unknown aetiology prevalent in intensive indoor culture, and growing public concern about the impact of farm effluents on the environment (Gousset 1992).
The European eel market is very diversified in terms of the quality of the requested products (ranges in size and types of preparation, etc.), the mean selling prices, and the preferred periods of consumption in each country.
There are two main markets in Europe: one for eels with an average weight of 150 g and the second for those above 300 g, most of which are entering the market as smoked eels. Smokers and traders are increasingly asking for well-graded soft eels, which is a quality mark that goes hand in hand with young fast growing eels. The demand for eels in Germany, the Netherlands, France, Denmark, Sweden and England is approximately 13 000 tonnes annually, for eels weighing 125-1 000 g (Tibbetts 2001). The main consuming countries are Italy, Germany and the Netherlands, which account for 80 percent, while 90 percent of the production comes from Italy, France, Denmark and the Netherlands (Petit and Rigaud 1993). Responding to a large demand in Europe at that time, Petit and Rigaud (1993) reported that there had been an increase in the import of other eel species, live or frozen (many cases without any sanitary control) at prices far below those of the native species. In 1999, the production of farmed eels clearly exceeded demand in Europe, a development that started in 1998. New farms had come on stream, while the market had not expanded and so could no longer consume the eels being produced. At the same time the Japanese market appeared almost inaccessible because of cheaper “kabayaki” (marinated roast eels) coming from China (Frost et al. 2000). This was unfortunate, since European expansion was to a large extent based on the establishment of Danish “kabayaki” plants. This had a detrimental effect on the prices for adult eels, and many farms saw their standing stock rise because of unsold eels (www.danafeed.dk/upl/doc/3.doc).
High Japanese market demand for “kabayaki” increases the price for European glass eels but the higher supply of “kabayaki” eels means price reductions for adult eels in this market. However, the European consumer market for eels is not thought to be linked with the Japanese market by Frost et al. (2000). There is still a demand from Spain for glass eels (20 tonnes in 1997) for direct consumption at Christmastime. This market is very flexible and nearly invisible. In 2002 a considerable amount of production was diverted to the Spanish market prior to Christmas, which in turn created a shortage for Asia, and a subsequent sharp rise in prices.
The unrelated and often local marketing activities of European producers and Asian markets are creating a volatile and uneconomic situation for producers. The industry relies heavily on glass eels and elvers for final production. When these are directly consumed, then the industry faces a shortfall of “seed” and, later, larger eels. This will drive the price up in Asian markets, creating another imbalance, while Europe continues to trade at lower prices. Eventually this could see a rise in European prices, or a fall in sales, further weakening the stability of the global eel market. Greater communication and planning is needed to stabilize the market.
¦ Conclusions
Globally, capture-based eel culture is still dependent on the capture of wild “seed”, but most eel stocks are overexploited. The main problem is the trade in glass eels and elvers, often caught for direct consumption and fetching higher market prices. The terminology for these life stages of eels is vague (glass eels or elvers), making it difficult to estimate the real trade in “seed material”. The marketing of “seed” and adult eels is complex and data sources conflict with each other, even within the same country.
Apart from some differences in the reporting and statistics available, the capture-based aquaculture of eels suffers from many of the difficulties seen in the other selected species dealt with in this report. On the negative side, the sourcing of “seed material” and the lack of other sources is a major concern for the future of the sector. However, the fact that eel feeds are available and that culture techniques (especially re-circulation systems) have very low environmental impacts and require limited land are positive factors.