Fishery trends
Both southern and northern bluefin tunas are captured worldwide. Because of their flesh quality, bluefin tuna are among the most desired and expensive species; the Japanese market (“sushi”1 and “sashimi”2 tradition) is the main driving force for the fishery.
Overfishing in many areas could adversely affect stock status. The northern bluefin tuna fisheries are therefore regulated by the International Convention for the Conservation of Atlantic Tunas (ICCAT), and the southern bluefin tuna by the Commission for the Conservation of Southern Bluefin Tuna (CCSBT). As a consequence of overfishing, regulations and quotas are annually established or revised by these regional management bodies. The global catch of all bluefin tunas was higher in 2000
(65 426 tonnes) than in 1991 (45 499 tonnes) but was well below the peak in 1996 (Figure 74).
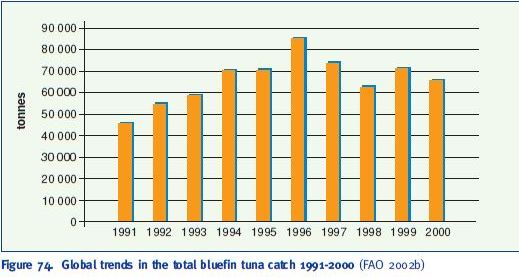
Figure 74. Global trends in the total bluefin tuna catch 1991-2000 (FAO 2002b)
Bluefin tuna fishing is mostly carried out using purse seines, longlines, traps, hand lines and harpoons (a traditional activity in the Straits of Messina, Italy), driftnets (now almost totally banned globally), etc. In 2000, the leading bluefin tuna fishery continent was Asia (25 762 tonnes), followed by Europe (20 288 tonnes), Africa (8 989 tonnes), Oceania (5 664 tonnes), North America (4 030 tonnes) and others (693 tonnes). The impact of intensive fishing is compounded by new fishing technologies, which make it possible to detect bluefin tuna shoals, e.g. helicopters and true-motion sonar systems; and a large proportion of the world’s bluefin tuna are now caught by industrial fisheries. The Mediterranean and the Black Sea areas accounted for 37% of the total catch of bluefin tunas in 2000, followed by the Northwestern Pacific (17%) and the Eastern Indian Ocean (14%) (Figure 75). At that time, Japan was the leading tuna fishing country with a catch of 18 984 tonnes, followed by France and Spain (Figure 76).
Purse seine fisheries have become the most important provider of tunas for capture-based aquaculture. Due to the technological developments of fishing operations, purse seining is more efficient than longlining as it targets identified shoals. The pressure on bluefin tuna fisheries in the Mediterranean area has increased considerably over recent years. International organizations such as the Conference on the International Trade of Endangered Species (CITES) have warned
1 Japanese cold snack of cold rice, flavoured and garnished (in this case with tuna) 2 Japanese dish of garnished raw fish in thin slices about a decline in the abundance of resources and the risk of their exhaustion. It is vital for future fisheries management to follow a precautionary approach, maintaining the status of these stocks in the absence of sufficient information, and to ensure that the existing equilibrium is not disrupted further (FAO/GFCM/CGPM 2003).
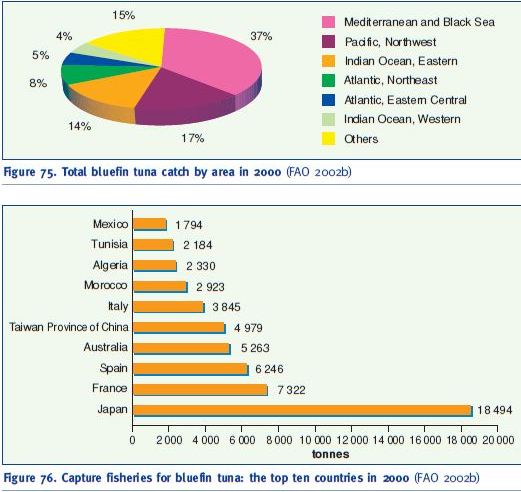
Figure 75. Total bluefin tuna catch by area in 2000 (FAO 2002b)
Figure 76. Capture fisheries for bluefin tuna: the top ten countries in 2000 (FAO 2002b)
Northern bluefin tuna
The catch of northern bluefin tunas (Thunnus thynnus) was greater in 2000 than in 1991 but peaked in 1996 (Figure 77).
Europe was the leading continent in 2000 (20 288 tonnes), followed by Asia (16 471 tonnes), Africa (8 987 tonnes) and North America (4 030 tonnes). Oceania ranked last with 21 tonnes.
The Mediterranean and the Black Sea are the major fishing areas, with 48% of the global catch in 2000 (Figure 78). The fishery was the first industrial fishery in the world using the traditional tuna trap, based in several places along the Mediterranean coastline. Economic support from Japanese interests to North African countries during the 1980s and 1990s, and joint ventures with European companies, have increased the fishery activities of Mediterranean countries and their commercial capacities (De la Serna et al. 2002). The Mediterranean is followed by the Pacific Northwest (22%) and the Northeastern Atlantic (11%) as the major capture areas (Figure 78).
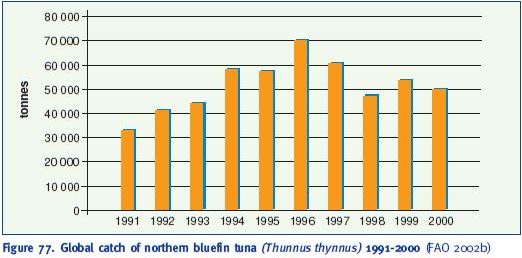
Figure 77. Global catch of northern bluefin tuna (Thunnus thynnus) 1991-2000 (FAO 2002b)
In 2000, Japan was the leading country with 12 163 tonnes (10 040 tonnes in Northwest Pacific, 890 tonnes in Mediterranean and Black sea, 553 tonnes in Northeast Atlantic, etc.), followed by France with 7 322 tonnes (Figure 79). In 2000, the catch of industrialized countries totalled over 30 000 tonnes, accounting for 67% of the total.
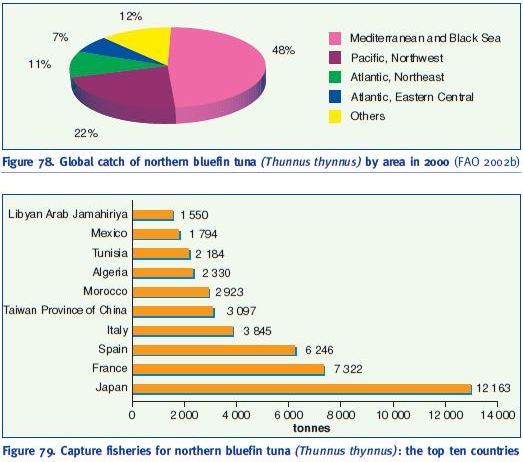
Figure 78. Global catch of northern bluefin tuna (Thunnus thynnus) by area in 2000 (FAO 2002b)
Figure 79. Capture fisheries for northern bluefin tuna (Thunnus thynnus): the top ten countries in 2000 (FAO 2002b)
Southern bluefin tuna
Southern bluefin tuna (Thunnus maccoyii) data shows a cyclical trend (Figure 80); the extremes during the decade 1991-2000 were from just over 12 000 tonnes to nearly 18 000 tonnes.
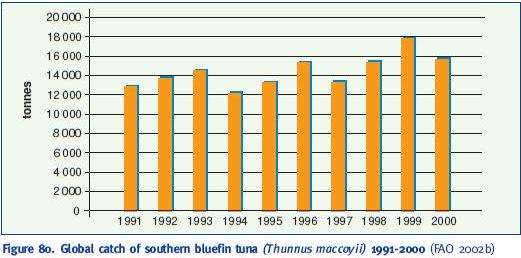
Figure 80. Global catch of southern bluefin tuna (Thunnus maccoyii) 1991-2000 (FAO 2002b)
In 2000, southern bluefin tuna (Thunnus maccoyii) was captured mainly in Asia (9 291 tonnes) and Oceania (5 643 tonnes). Total captures for 2000 amounted to 15 629 tonnes. The Eastern Indian Ocean area accounts for nearly 60% of the total with a catch of 9 317 tonnes (Figure 81). During the past two years (2001-2002), the main fishery area in Australia is around Port Lincoln (South Australia), with purse seine fleets as the main catching method.
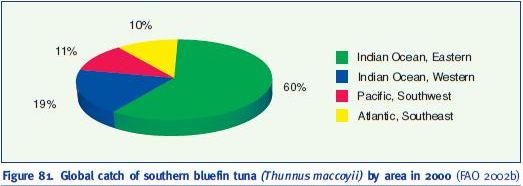
Figure 81. Global catch of southern bluefin tuna (Thunnus maccoyii) by area in 2000 (FAO 2002b)
In 2000, Japan was the leading fishing country with 6 331 tonnes, followed by Australia with 5 263 tonnes (Figure 82). In that year, most southern bluefin tuna (76%) was caught by the fishing fleets of industrialized countries. 12% was caught by Taiwan, Province of China.
The capture-based aquaculture of southern bluefin tuna began as a result of the declining Australian fishery for this species. The Australian catch peaked in 1982 at 21 500 tonnes (Fishstat Plus 2002) but, owing to increasing concerns about the sustainability of the fishery, a TAC (total allowable catch) system was implemented by the CCSBT to limit and manage the catch. Steadily reducing TACs (14 500 tonnes in 1984, 6 250 in 1998 and 5 265 tonnes since 1990) provided the necessary incentive for southern bluefin tuna fishing operations to investigate the potential for capture-based aquaculture (Clarke 2002). Today, Australian bluefin tuna is mainly sold to Japan; in 2001, 99% of the Australian bluefin tuna farmed in Port Lincoln (South Australia) was exported to the Tsukiji market, Tokyo.
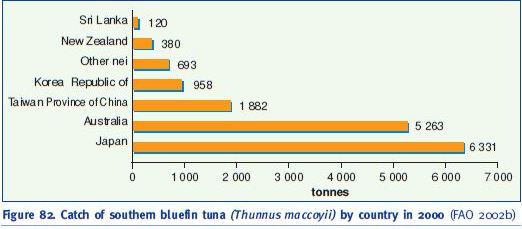
Figure 82. Catch of southern bluefin tuna (Thunnus maccoyii) by country in 2000 (FAO 2002b)
Japan is the main market for the bluefin tuna caught in the global fisheries: the Japanese custom to eat fresh tuna as “sushi” and “sashimi” is the driving force behind the development of tuna fishing, and is also supporting the development of the capture-based aquaculture sector, worldwide.