3. Marine finfish aquaculture fa cility in Indonesia selected for application
The effectiveness of the processes and steps for improving spatial planning is demonstrated for a marine finfish aquaculture operation in Pegametan Bay in the northwest of Bali, Indonesia. The environmental characteristics of the site in question and information on cultured commodities are introduced. An overview of the high-resolution measurements and simulation models is provided.
3.1 E nvironmental Characteristics of Pegametan Bay in Bali
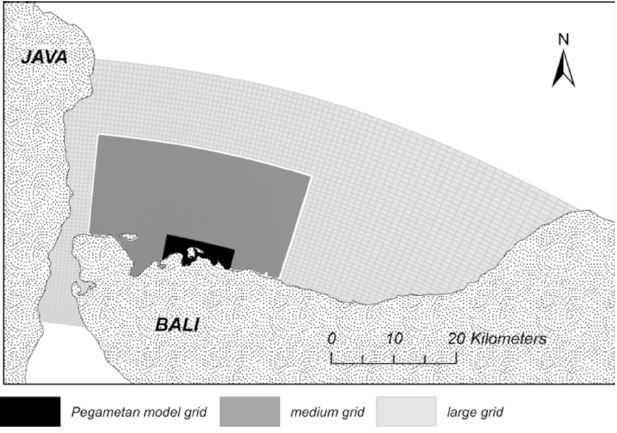
The area of interest covers about 35 km2 along the coastal stretch of around 10 km (see Figure 3 and model domain in Figure 4). The site is characterized by a shallow inner coral reef platform in the centre, which partly falls dry at low tide. Two main channels flank the coral reef system (Figure 3). The flow in the bay is tide dominated with a maximum tidal range of 1.8 m. Current velocities are up to about 0.15 m/s and 0.4 m/s respectively during neap and spring tides.
The channel to the west is shallower and current velocities are smaller. The channel in the centre of the bay reaches water depths of about 25 m and current velocities are higher as the channel is open to both ends of the bay (see Figure 3). Wind speeds up to 12 m/s are observed in the northwest of Bali.
The annual water temperature and salinity ranges from 27 to 31°C and 28 to 35 PSU respectively. From July till September during winter months in Australia, water temperature in the bay may drop to around 26°C. Prevailing sediments are medium and coarser coral sands, and coral detritus. An outer reef belt protects part of the bay from the waves in the open sea. Outside the bay water depths rapidly increase to several hundred meters.
3.2 C ultured Species and Fish Farm Production of Pegametan in Bali
The northwest of Bali is one of the main producing centers of marine finfish aquaculture in Indonesia.
Total fish production nowadays ranges between about 900 and 1,100 t/year. Currently there are two main sites in operation, namely Pegametan Bay and Patas, producing respectively ca. 55–70 tonnes/month and 20–25 tonnes/month. Marine finfish aquaculture has been practised in Pegametan Bay since 2001 and has grown to a total of 30 farms in 2015. Species cultured are mainly Asian Sea Bass (Lates calcarifer), Humpback Grouper (Epinephelus altivelis) and some species of ornamental fish. Figure 6 shows the location of the farms in Pegametan Bay. There are 10 medium-scale farms (20 to 100 cages) and 16 large-scale farms (more than 100 cages). The floating net cages of most farms consist of wooden rafts, kept afloat by plastic drums (Figure 2). Each cage typically measures 3 m 3 3 m 3 3 m. Cages are connected together forming a floating raft in order to reduce the effects of waves and currents. The two largest farms in the bay (see farms numbered 21 and 30 in Figure 6), comprise
Figure 1. Traditional fish farm in Pegametan Bay.
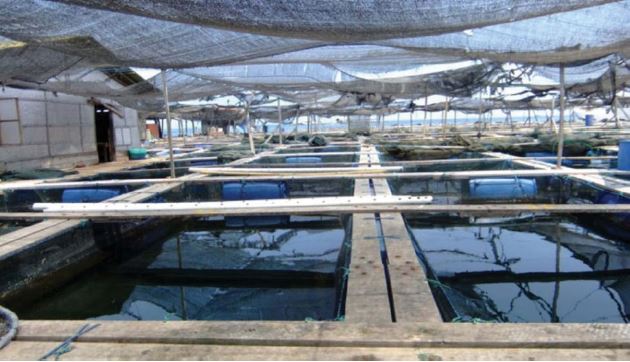
Figure 2. Fish farm in Pegametan Bay using several circular cages.
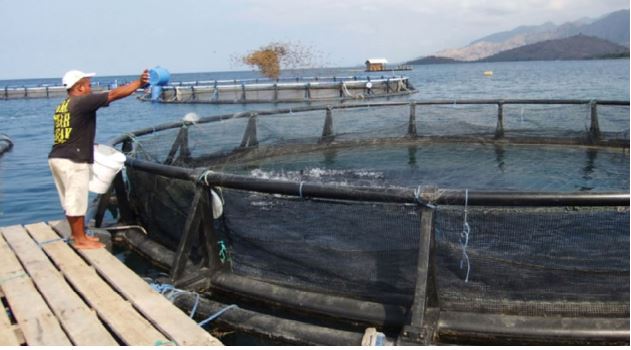
Figure 3. Pegametan Bay.
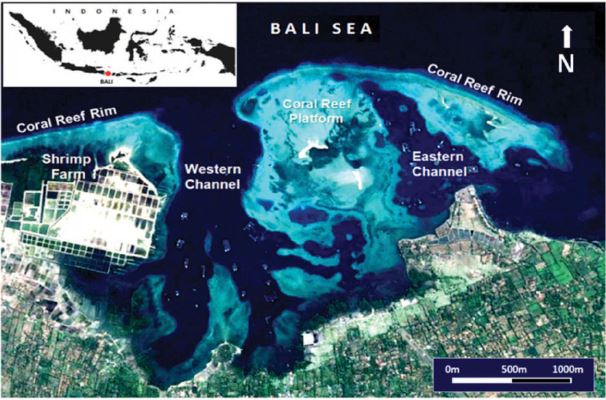
Figure 4. Grids of Pegametan Bay model.
of 7–8 circular floating units made of high-density polyethylene for nursery and on-growing (see also Figure 2). The cages are 20 m diameter each with a cubic capacity of about 2,000 m3 per cage.
The overall standing stock of the 30 farms in Pegametan Bay was about 345 t during the assessment in 2015. Table 5 lists for each farm the number of cages, farm volume and estimated standing stock of farms. On the western channel there are 18 farms with less than 400 cages each (see farms numbered 1 to 18 in Figure 6). The total farm area is ca. 2.2 ha. The standing stock of the farms varies from a few hundred kilos to 20 t. The overall standing stock in the western channel is about 130 t. On the central channel there are 10 typical fish farms with up to 320 cages and two larger farms with 7–8 circular cages (farms numbered 21 and 30 in Figure 6, see also Figure 2).
The total standing stock in the central channel is ca. 210 t and the area covered by the cages is ca. 1.8 ha.
Fish production in the two largest farms is in the order of 45–55 t/month corresponding to over 3/4 of the total production in the site.
In addition to grow-out activities, there are several backyard hatcheries along the coastline to the east of the bay. About 90 percent of the seeds sold in Indonesia stem from these hatcheries. There are also small amounts of algae, pearl oyster and shrimp being cultivated in and along the bay. In the vicinity of the inner coral reef platform dividing the two channels, small amounts of seaweeds (Euchema and Glacilaria) are cultivated. To the east of the bay, there are two big cages growing pearl oyster (Pinctada sp) and on the southeast a few pearl rafts are placed. At present there are approximately 800,000 shells for inoculating core of pearl. Along the coastline there are a few shrimp farms stocked with Pacific White Shrimp (Litopenaeus vannamei and Penaeus vannamei). The location of the shrimp ponds, covering an area of about 130 ha, is shown in Figure 3. Shrimp production per pond varies between 8 and 15 t/cycle.
3.3 H igh-Resolution Measurements at Pegametan Bay in Bali
An array of high-resolution surveys and mapping technologies was used to assess the interactions between the environmental conditions and fish farms.
Data from existing databases and large-scale global models was supplemented with remote sensing information of farm locations, bathymetry and tidal constituents. Gaps of information were identified and several measuring campaigns carried out. Emphasis was given to the data required for the development of simulation models and for gathering chemical data for site selection. Measuring campaigns were carried out in January 2008 during the rainy season, September 2011 towards the end of the dry season. Bathymetry in the bay was measured with a vessel mounted echosounder.
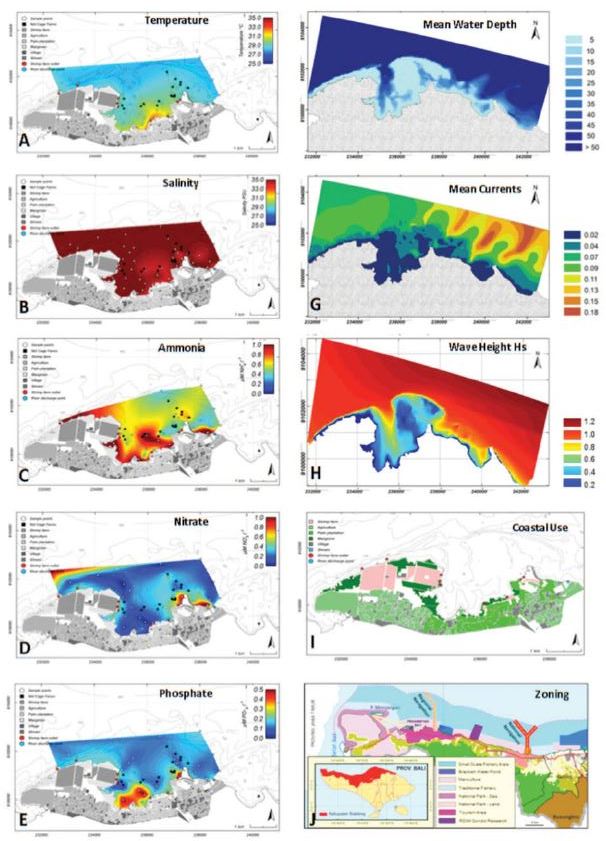
A tidal gauge was installed within the bay for continuous measurement of water levels for calibration and validation of the flow model. Vessel mounted CTDs were deployed in conjunction with Niskin bottles throughout the entire bay for water quality. To obtain high-resolution information on the spatial variability of nutrients about 50 surficial water samples were taken in Pegametan Bay. Maps are shown on the left hand side of Figure 5. Seabed sediment samples were taken underneath several farms and away from fish farms for reference in December 2015 and January 2016.
Sediment samples were analyzed for RedOx potential, grain size distribution, and particulate C and N.
3.4 H igh-Resolution Simulation Models of the Pegametan Bay in Bali
A three-dimensional coupled flow and wave model was developed for the site under investigation.
Model development was based on the Delft3d model suite (Roelwink and van Banning, 1994). The model covers parts of the southern Bali Sea and the Bali Strait as shown in Figure 4. In the outer parts, model development relied on data from global databases and large-scale models. The bathymetry was developed using data from the General Bathymetric Chart of the Oceans (GEBCO) and the Indonesian National Survey agency (Badan Informasi Geospatial). Within the bay, data recorded from their own echo-soundings was used in the model. Sub-domain decomposition using three computational grids with increasing grid resolution towards the coast was adopted (see Figure 4).
The grid resolution ranges from about 800 m in the Bali Sea to 25 m within the bay. Over the vertical 5 sigma-layers, each covering 20 percent of the water depth, were used. Astronomical tidal constituents from satellite altimetry were imposed at the open sea
Figure 5. Mapped layers adopted for site selection of marine finfish farming facilities in Pegametan Bay.
boundaries of the model. The model is forced with space and time varying winds and pressure fields from the NCEP/NCAR reanalysis database. Predicted water levels coincided with measured values with an average error of about 6 cm. Waves are simulated with the fully spectral model SWAN, developed at the Technical University Delft in the Netherlands (Booij et al., 1999).
SWAN accounts for wave propagation, refraction, and shoaling, wind-induced wave generation, wave dissipation and non-linear wave-wave interactions.