4 S patial Planning Processes and Steps applied to the site at Pegametan Bay in Bali
Results of the application of steps and procedures within an integrated ecosystem-based approach for enhancing spatial planning in Pegametan Bay are presented hereafter. The steps comprise of scoping, zoning, site selection and carrying capacity. Emphasis has also been given to biosecurity in particular to the measures being adopted to minimize fish diseases.
4.1 Scoping
Scoping comprises the establishment of the management objectives, boundaries and institutional as well as legal frameworks. Marine finfish aquaculture and tourism are the main activities with economic relevance in the region. In the beginning of 2008, there were about 17 relatively small fish farms within the bay the majority of which containing less than 150 cages.
The standing stock in 2008 was estimated as about 90 t. Groupers was the main farmed species and trash fish/low value feed the main feeding source at that time. Since then the number of farms duplicated and the sizes of farms increased significantly leading to a standing stock of about 345 t in 2015. Pegametan Bay is a typical example that aquaculture can help improve the livelihood of fish-farmers and fisherman living along the coast. In addition to the fish farms, there are also several backyard hatcheries along the coastline providing social and economic benefits to the local population.
Assessments of the coastal uses and ownership were also done. As fish farms are located within 4 nm from shore, the Marine and Fisheries Services of the Singaraja Regency (MFS) is granted authority to manage aquaculture. Further stakeholders in the region are the Farmers’ Association and RDIM. AMAFRAD and RDIM assist the Farmer’s Association with technical issues related to mariculture development and provide support on seed techniques and other matters. Currently fish farms in the bay have less than 1000 cages and thus exempt of EIA but subject to other licensing/permitting requirements such as voluntary measures and/or good aquaculture practice.
Regarding water quality, the aquatic environment is in good condition. The analysis was based on water sampling throughout the whole bay. Maps of nutrient distribution are shown in Figures 5C to 5E. Farm emissions were found to have only minor effects on the concentrations of nutrients within the bay. On the other hand small rivers and the outlets from the shrimp farms to the west of the bay showed locally slightly higher levels of DIN. Particularly the drainage of ponds under east-west longshore currents can have a significant impact on the levels of water quality in the bay. In general, the observed DIN values and levels of phosphorus remained below critical values that can impact on coral reefs (FAO, 1989 and Lapointe, 1997).
Only in the near vicinity of the two larger farms (see farms 21 and 30 in Figure 6) a certain decrease of DO is observed in the layers closer to the seabed. Assessments of sediment quality indicate that there are clear signs of sediment degradation underneath the two larger farms (see farms numbered 21 and 30 in Figure 6). Underneath most farms and also at reference locations, sediments remain in good conditions.
4.2 Zoning
There are currently three legislated zoning schemes and procedures dealing with aquaculture development under the umbrella of MMAF. There is an inter-sectorial zoning scheme accounting for the majority of coastal uses, the Minapolitan zoning for centres engaging mainly on aquaculture activities and another scheme focusing exclusively on aquaculture issues. Table 1 summarizes the aims, legal instruments and agencies in charge of each scheme. The schemes have different objectives, though each and all of them together, serve a common purpose from different perspectives.

Figure 6. Suitable areas for marine finfish farming and location of farms in Pegametan Bay in 2015.

Table 1. Overview of zoning schemes for aquaculture in Indonesia.
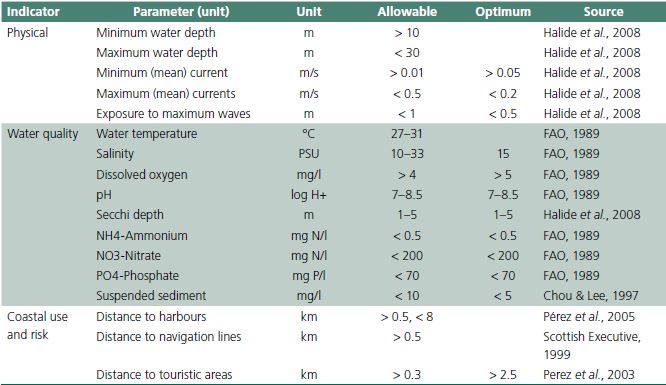
Table 2. Criteria for coastal planning (Wiryawan and Tahir, 2013).
.")
The inter-sectorial zoning scheme is under the responsibility of the Directorate General of Coastal Zones and Small Islands. It was established to minimize conflicts among different coastal uses and stakeholders. It defines guidelines and activities that are allowed, permitted with license, and/or prohibited in the region.
Table 2 lists the criteria considered for marine finfish aquaculture and other activities.
The Minapolitan zoning (mina from Sanscript for fish and politan from Greek for city) was tailored for sites with on-going aquaculture activity. The scheme was established by the DGA and it is part of the Minapolitan Program (MP). MP aims at promoting the designation of zones with multiple functions such as centre of production, processing and marketing of fisheries commodities, services, and/or other supporting activities. The selection of so-called “fish cities” takes into consideration the ongoing aquaculture and/or fishery activities, social infrastructure, and market conditions. The environmental characteristics are not accounted for in this scheme.
The aquaculture zoning is the responsibility of AMAFRAD through CARD. Sites preselected for marine finfish aquaculture activity on the basis of one above zoning schemes have to undergo this zoning scheme. Several factors and constraints relevant to aquaculture activities are accounted for. They include bathymetry, land quality, water quality, climate, sediment, and oceanographic aspects. Table 3 presents the criteria and threshold values adopted for marine fish aquaculture (Radiarta et al., 2014a). Score factors are defined according to the level of importance to specific fish species. Suitability scores are ranked and classified in accordance with the procedure proposed by FAO (1977).
The resulting inter-sectorial zoning plan for the northwest coast of Bali is shown in Figure 5.
Pegametan Bay has been designated for mariculture activities whereas the adjacent coastal areas mainly for tourism and natural conservation. Results of the present investigation have shown that Pegametan Bay is well suited for marine finfish aquaculture activity in accordance to the aquaculture zoning. An assessment of the physico-chemical properties presented hereafter shows that the bay meets all the requirements and threshold values for marine finfish aquaculture sites listed in Table 4.
4.3 Site Selection
Site selection refers to the identification of areas within a coastal environment, which are suitable for the installation of floating net fish cages. Based on literature review and present scientific knowledge, environmental suitability criteria and threshold values applicable for potential aquaculture sites have been identified. Table 4 lists the criteria and threshold values usually adopted for target finfish species in South-East Asia. Criteria taking into account physical characteristics, water quality standards and coastal uses and risks are considered (FAO 1989, Chou and Lee 1997,
Table 3. Requirements for marine fish cage culture (Radiarta et al., 2014a).
.")
Table 4. Criteria and suitability thresholds for site selection applied to South-East Asia.
Scottish Executive 1999, Perez et al. 2003, Pérez et al. 2005, Halide et al. 2008).
Figure 5 shows the thematic maps used for characterization of the site. Figures 5A to 5E display respectively the spatial variation of water temperature, salinity and several nutrients namely ammonia, nitrate and phosphate. Maps were obtained from the analysis of over 50 surficial water samples throughout the entire bay. Figures 5F, G and H show the spatial variation of the main physical properties relevant for fish farming.
It includes the depth of flow, current velocities and waves. Results of flow model simulations covering a full neap-spring tidal cycle are used for determining the spatial and temporal variation of water depths and current velocities. Waves are obtained from wave model simulations for storm events with different intensities. Simulations were done for different recurrence intervals of storms. In the figure modeled waves for a 10-year recurrence period are displayed (Figure 5H). Coastal uses derived from own assessments and obtained from the inter-sectorial zoning plan are shown respectively in Figures 5I and 5J. For each thematic map, templates are built using GIS tools embedded within the decision support system SYSMAR according to the threshold values listed in Table 4. The overlay of all the templates generates the suitability map for the marine finfish aquaculture facility in Pegametan Bay (see Figure 6). In the figure green colored areas indicate those areas suitable for finfish aquaculture. Water temperature, salinity and the main water quality properties resulted within the ranges found adequate for finfish cage aquaculture operations. Water depths, current velocities, waves and the regional navigation lane to the east of the bay turned out to be the main controlling factors for farm siting in the bay.
A total area of ca. 145 ha turned out to be suitable for finfish aquaculture within Pegametan Bay. More specifically 64 ha on the western channel and 81 ha on the central channel were identified as suitable areas.
The total area of cages of the 30 fish farms currently in operation is approximately 4 ha corresponding to less than 3 percent of the suitable area. Figure 6 shows the location of the operational farms in conjunction with the identified suitable areas. It can be seen that despite the availability of space, several farms are located outside of suitable areas in Pegametan Bay.
Particularly, farms numbered 10, 11 and 12 on the western channel are outside suitable areas and too close to the coastline. Results of an assessment of fish health revealed that these farms are generally subject to higher risks of fish disease and that fish growth was generally lower than in farms located within suitable areas. Therefore relocation of these farms to suitable areas can be regarded as one of the main priorities to enhance environmental sustainability in Pegametan Bay. It should be noticed that farms 5, 6 and 7 are also misplaced but fish production is sporadic and very low there (see Table 5). Hence it is recommended to monitor conditions in these farms before deciding for relocation.
Spatial planning of aquaculture is also essential to establish and maintain healthy animal stock through effective separation of farms and individual production units within the farms. Farm spacing in Pegametan Bay was assessed on the basis of transport distances of fish farm waste following Gillibrand et al. (2002). Current velocities at farm locations and a range of settling velocities of fish farm waste based on fish species and type of feeding (ws) were considered. On the western channel transport distances barely reach 50 m. Hence no interactions among the farms is anticipated for the current farm layout and additional farms could be placed there. On the central channel, transport distances are up to 150 m. Despite the fact that there is sufficient distance among farms and much space left for placing new farms, attention should be given to farms 21 and 30. As fish production is very high, separation of individual production units for nursery and grow-out is essential for keeping the total amount of fish within carrying capacity of the environment, helping safeguard adverse effects.
4.4 Ecological Carrying Capacity (ECC)
ECC of marine finfish aquaculture is defined here as the magnitude of aquaculture production that can be sustained without significant changes to ecological processes, species, populations, or communities in the environment (Byron and Costa-Pierce, 2013).
Environmental impacts associated with marine finfish aquaculture stem mainly from nutrient inputs from uneaten fish feed and fish wastes. High percentage
Table 5. Assessment of the marine finfish aquaculture facility in Pegametan Bay (Nov. 2015).
.")
of phosphorus, carbon and nitrogen inputs are lost to the environment. These nutrient inputs may lead to localised water quality degradation and sediment accumulation underneath farms. In severe cases, in which standing stock exceeds ECC, environmental sustainability is undermined. Although the localized impact of smaller farms in South-East Asia is usually relatively small, the impact of the incoming larger farms and the cumulative impact of many farms on the environment can be significant. That is why this study has sought to adopt methods both for estimating ECC at the farm level and accounting for the cumulative effect of all the farms in the environment.
Farm ECC is based on sediment accumulation underneath farms. ECC are estimated based mainly on hydrodynamics from measurements and/or model simulations. The method implemented in SYSMAR estimates the maximum fish production for the given Reynolds number (Re) at the fish farm location, ws and user-defined threshold loads in terms of carbon deposition in the seabed (Niederndorfer, 2017). Re is defined as the product of mean water depth and the mean depth-averaged velocity for a neap-spring tidal cycle divided by the kinematic viscosity of water. ws is a function of fish species farmed and feeding method adopted in the site. Regarding the limits in terms of carbon loading underneath farms, field investigations of the impact of fish farms showed that adverse changes in the benthic community are observed for rates exceeding about 1 to 5 gC/m2d (Angel et al., 1995, Krost 2007, Hargrave 2010).
Figure 7 shows the spatial variation of the modeled Re for a neap-spring tidal cycle in Pegametan Bay.
Values up to about 170,000 and 585,000 resulted respectively on the western and central channels.
The higher Re in the central channel are due to the higher current velocities there. Based on Re and in-situ observation, farms sizes on the western and central
Figure 7. Modelled averaged Reynolds numbers for a mean neap-spring tidal cycle in Pegametan Bay.

channels were limited respectively to 300 and 500 cages. Threshold values in terms of carbon deposition underneath farms of 5 gC/m2d are assumed here. To provide a good coverage of the farm waste of the site, ws values ranging between 0.03 m/s and 0.10 m/s were considered in the estimation of farm ECC.
Table 5 lists for each fish farm the number of cages and volume, Re at farm location, current standing stock and ECC. The ranges of predicted farm ECC values reflect the adopted range of ws. Predicted farm ECC values are compared to the current standing stocks of fish farms (Table 5). The results showed that so far farm ECC are exceeded only at the two larger farms (see farms numbered 21 and 30 in Figure 6). In the remaining farms, standing stocks are usually lower or comparable to the predicted ECC values. Hence according to the predictions, the standing stock of all the farms in Pegametan Bay could be up to about 660–800 t as compared to the current standing stock of about 345 t.
Model predictions were validated on the basis of the analysis of in-situ seabed sediments. Sediment samples taken underneath 11 farms and at 10 reference locations were used. Benthic conditions were assessed using video recordings and analysis of physic-chemical properties of surficial sediments. Figure 8 shows measured organic matter against concentration of particulate organic N of all sediment samples. The organic matter was determined through loss of ignition of sediment samples at 550°C. The effect of organic waste on the sea floor due to fish farming is evident underneath farms where deposition rate of organic waste exceeds the bacterial decomposition of the waste. In particular the sediments under farms 21 and 30 show high organic content, which is in good agreement with model predictions. According to the predictions the standing stock of these farms 21 and 30 is much higher than the predicted ECC values (see Table 5). Underneath farms where fish production is lower than predicted ECC values, impacts of organic waste are low or insignificant. Sediment samples are light grey and concentrations of N are just above natural conditions and/or comparable to the samples taken at reference locations (see Figure 8). Fish farm impact is also reflected on the levels of DO. At most
Figure 8. Assessment of sediment quality underneath fish farms in Pegametan Bay.

production should be reduced there. Emphasis should also be given to the biosecurity framework, particularly concerning the effectiveness of the proposed measures to minimize fish mortality. Further measures include the adoption of improved feeding methods and establishment of a regular environmental monitoring program.
This should be supplemented with regular assessments farms, DO profiles resemble natural conditions.
However, near farms 21 and 30 there is a decrease of DO in the bottom layers.
Cumulative ECC is based on water quality degradation.
ECC is dictated by the rate at which nutrients can be added without triggering eutrophication. It is assumed that the emitted load of dissolved inorganic nitrogen (DIN) from all farms within the site should not exceed 1 percent of the total amount of DIN load entering the water body (Weston, 1986). The rate of DIN entering Pegametan Bay is obtained from flow model simulations covering a full neap-spring tidal cycle in conjunction with measured concentrations of DIN measured just outside the bay. The limit of nitrogen emission is subsequently converted into the maximum allowable standing stock. According to the results, cumulative ECC of all the farms in Pegamentan Bay should not exceed ca. 500 t to 900 t of Grouper respectively for the lowest and highest observed nitrogen fluxes (van der Wulp et al., 2010).
In summary, results of the assessment indicate that there are several farms currently out of suitable areas and that the two largest farms exceed ecological carrying capacity of fish farm production. Yet with proper siting of farms and controlled increases in farm production, the current whole aquaculture production in the bay, currently about 345 t, could be increased without harming the environment. As only a small percentage of the suitable areas is currently being used and most farms employ traditional technologies there is plenty of room for expansion. However, in view of the unknown ecosystem threshold and uncertainties in the predictions it is recommended to adopt a cautionary and adaptive approach based on regular monitoring to guarantee environmental sustainability.
4.5 Biosecurity Framework
The main reason of fish mortality in Pegamentan Bay is infection of seeds by Nervous Necrosis (VNN) and Irrido viruses. This is because fish seeds are not yet being thoroughly tested. To maintain healthy animal stocks, the GOI recently passed a regulation requiring that fish seeds, both from public and private hatcheries, must be Specific Pathogen Free (SPF) certified and have standard sizes for given ages. At the site in question, IMRAD Laboratory at RDIM has been responsible for certification. Farmers must request SPF certification and follow standard size before buying fish seeds, and only certified seeds can be sold. Currently real-time PCR is being adopted in the site to ensure that seeds are SPF (Mrotzek et al., 2010). The establishment of quarantine offices for monitoring fish diseases and environmental conditions in aquaculture sites is another measure being demanded by the GOI to enhance biosecurity.
By monitoring fish diseases at local hatcheries the quarantine office helps control fish diseases in the area.
Fish health and welfare in Pegametan Bay are also directly related to environmental conditions. It was found that disease outbreaks are associated to sudden drops in water temperature (Radiarta et al., 2014b). In particular, changes in water temperature at the beginning of rainy seasons in Indonesia, from mid September to the end of October, and occasionally during winter months in Australia, from July till September, exacerbate fish diseases. Such temperature drops in conjunction with runoffs and wastewater from adjacent shrimp ponds, cause stress to the farmed fish and increase their susceptibility to diseases. To reduce risks, an operational system for real-time monitoring of water temperature was set up. Real-time data from three stations in the bay is transmitted to RDIM in Gondol and CARD in Jakarta. Early warnings are delivered to farmers by SMS, once sudden changes in water temperature occur. To increase immunity and reduce stress of fish during such conditions, fish are usually fed an artificial diet enriched by 1 percent of Vitamin C.
The system proved to be quite effective in the minimization of fish diseases. Extensions of the system for monitoring additional water quality quantities such as salinity and turbidity have been proposed. This would enable detecting, for example, runoffs during the rainy season and waste water from the nearby shrimp farms.