SITE SELECTION CRITERIA
There are different parameters and factors that need to be taken into consideration during the site selection process. These can be grouped into three categories (Table 5).
TABLE 5
Parameters and factors to be considered in the site selection process
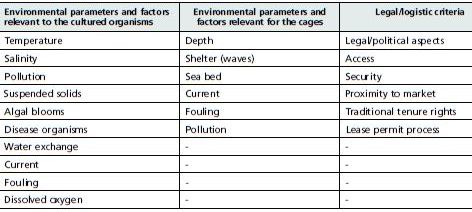
Source: After Beveridge, 2004.
Environmental criteria for organisms
Cage sites must have good water quality. Not only must the water be free of industrial pollution, but the water should also meet the biological requirements of the farmed species.
These criteria include appropriate temperature, salinity and dissolved oxygen (DO) necessary for the cultured species. The water should be free of excessive suspended solids, with limited occurrences of algal blooms and presence of diseased organisms. Some current is necessary to ensure adequate water exchange, but too much current will add stress to the organisms and the equipment.
Dissolved oxygen
Dissolved oxygen (DO) is one of the most important parameters to consider when choosing a site. Oxygen requirements vary with species, stage of development and size of fish. The level of DO is influenced by temperature, and it directly influences the feed conversion ratio (FCR). The lower is the DO in the water, the higher the final FCR will be, which will result in higher feed costs.
The level of DO may also be influenced by algal communities. Diurnal photosynthesis increases DO, while nocturnal respiration decreases DO. The highest level of DO is in the late afternoon, and the minimum in the pre-dawn hours.
Algal blooms can dramatically influence the DO as mentioned above, but there is also a further reduction in DO when there is a change in oceanic conditions that causes algal blooms to suddenly die, or crash. With algae mortality, the decomposition of the biomass will lead to a DO decrease, sometimes reducing DO to zero.
The level of DO is also influenced by fouling of the cage, because the growth of organisms on the net may reduce the water exchange. The level of DO may be reduced during feeding, but this is usually only temporary and normal values will return in a few hours.
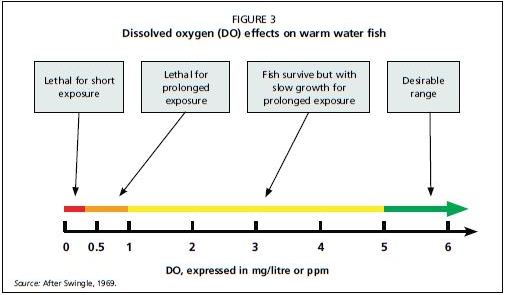
As a generic reference, Swingle (1969) developed a DO scale for warm water fish species (see Figure 3):
DO= <0.3 mg/litre - fish die after short-term exposure;
DO= 0.3-1 mg/litre-lethal for long-term exposure;
DO= 1-5 mg/litre - fish survive, but growth is slow for prolonged exposure; DO=> 5 mg/litre - minimum for warm water fish species (fast growth). Target species should be clearly identified before the site selection process, and their oxygen requirements researched in order to avoid selection of sites with insufficient DO for that species.
FIGURE 3
Dissolved oxygen (DO) effects on warm water fish
Pollutants
A variety of pollutants can damage the cages (net and structures) and can negatively affect the farmed fish stock causing mortalities or contaminating the fish to such a degree that the fish cannot be traded for human consumption.
Risks can be minimized by avoiding highly industrialized areas, although pollutants may also occasionally occur as a result of maritime traffic (e.g. oil spills and tank cleaning).
Cooling water effluents from power stations can also contain chemicals and biocides (e.g. chlorine, corrosion inhibitors, solvents and heavy metals) that may be lethal to the stocked fish.
Rivers may contain debris or large floating objects (e.g. timber, driftwood) that may damage the net if brought onto the site by the current.
Temperature
Temperature has a direct influence on the metabolism of fish, and consequently on their oxygen consumption and rate of activity, as well as tolerance to ammonia and carbon dioxide levels. A sudden variation in temperature may be a source of stress to the fish and may facilitate disease outbreaks. It is important to appreciate that:
Water temperature in coastal areas is influenced by freshwater influx from streams and rivers, which are influenced by seasonal variation in rainfall.
• Temperature range will be greater in shallower waters.
• Solar radiation received by a body of water is absorbed solely by the first few metres of water. If there is no mixing, the water will become stratified and the water column temperature may vary dramatically from the surface to the cage base.
Salinity
Salinity is the amount of dissolved salts in the water, usually expressed in parts per thousands (ppt or /00)
Unsuitable salinity levels can negatively influence feeding, the FCR and the specific growth rate (SGR).
Significant salinity variations contribute towards stress, which may depress the immune system of the farmed fish, making them more susceptible to infections from parasitic organisms and other diseases.
Estuaries are sites where salinity variations often occur, and they should be avoided if the fish species being cultured are sensitive to variations in this specific environmental parameter.
PH
The pH level is a measure of acidity. Pure freshwater has a neutral pH value (close to 7.0 at 25 °C). Values lower than 7 are acidic, while levels higher than 7 are basic or alkaline. pH is defined as a negative decimal logarithm of the hydrogen ion concentration in a given solution.
Seawater is soundly buffered against pH variation, and as such the pH is usually in the range of 8.0-8.2.
In freshwater, pH variations can occur owing to acid rain precipitation. This typically happens at the end of the winter months in areas where there is an abundance of melted snow flowing into the surrounding waterbodies.
Disease
Some pathogenic agents are present in the environment, especially if sites are located in polluted areas (e.g. harbours, near untreated sewage outlets, closed basins with poor water exchange). Bacterial diseases are often associated with poor water quality.
Some sites harbour intermediate or definitive hosts of parasites that can switch hosts from wild fish to farmed fish. This is not easy to evaluate a priori, although a laboratory specializing in fish diseases could advise on possible disease outbreaks in wild fish populations at the target site.
Turbidity
Farms should be situated in areas with relatively clear water. Suspended solids should preferably be less than 5 mg/litre and should not exceed 10 mg/litre. Turbid water is not suitable for fish farming for the following main reasons:
Silt particles in turbid water contribute to fouling. When deposited on the net, they accelerate fouling by serving as a substrate for the growth of fouling organisms. The inability of the fish to see feed impacts feed efficiencies. Some fish also do not feed adequately when the water is turbid.
Silt particles in large amounts can clog fish gills causing mortalities resulting from asphyxiation.
Turbidity is most likely to be caused by water runoff from land, or from currents or waves lifting silt deposits on the substrate.
Environmental factors on fammed structures
Along with the factors that may affect farmed fish, in the site selection process one must consider all those factors that can have an influence on the cage installation, barges and marine signals. It is essential to consider the following factors when choosing the cage model, in designing and constructing the mooring system, as well as in the selection of the service vessel:
bathymetry or site depth (i.e. seafloor terrain and depth contours); current speed and direction;
wind;
wave height and period;
sea bed (i.e. bottom type);
storm and hurricane incidence.
Bathymetry
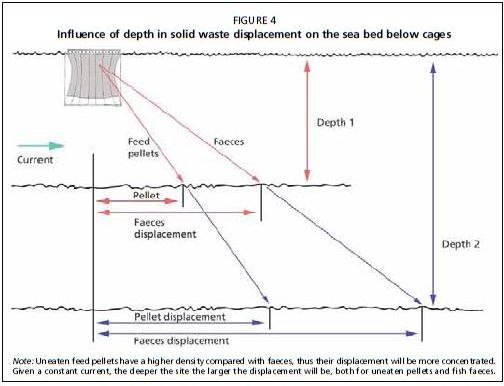
The water depth, in combination with the average current speed and direction, can determine the concentration of waste sediment in the area around the cages (see Figure 4).
Depth can also have the following impacts:
Farm footprint: the greater the water depth, the larger the farm footprint will be, because the length of the mooring lines is usually three to five times the site's depth. ? Mooring design: site depth may influence the equipment and materials used for moorings, including their dimensions.
• Diving inspections: diving deeper than 50 m will present a problem for professional divers, who require specific training, and professional and expensive gear for working at greater depths. Although anchor inspection is not a routine procedure, this issue should be considered when selecting the site.
Cage net depth: as a rule of thumb and depending on the current velocity, it should be no deeper than one-third of the site's depth and at least 15 meters should be left between the net base and the sea bed (at low tide), to permit a wider and better dispersion of cage waste particulate. Thus, a shallow site will result in the need to use short nets and, consequently, cage volumes will be smaller than in a deeper site.
During any project development phase, the water depth should be studied on a marine chart and then properly verified through an extensive field survey. Bathymetric transects are a good way to survey the area and find the most suitable location, which should be, as far as possibly, flat and without rocks or coral formations that could provide points of tearing for the mooring lines.
A site survey can be also executed with the support of a dedicated depth scanner (e.g. portable 3D OLEX scanner) that can return comprehensive and detailed information on the seabed characteristics.
In many cases, the wave action in shallower waters (if not sheltered) is more violent. Shallower waters experience higher waves. A shallow site may be subjected to severe wave conditions, thus requiring stronger cage-net-mooring engineering than in locations in deeper water. Such conditions may also increase the probability of fish stock damage within the nets.
Note: A typical pitfall is to install a cage system too close to the shore both in terms of water quality and forces.
FIGURE 4
Influence of depth in solid waste displacement on the sea bed below cages
Current speed and direction
Current speed has a direct influence on the cages as it accounts for 70-75 percent of total forces on a typical mid-size cage farm (ie. with a production between 3 000-4000 tonnes/year); it mainly affects:
? water exchange in the cage (cages);
? feed dispersion;
cage net weights and sinkers;
? cage movements and fish transfers; net shape and rearing volumes; diving operations;
solid effluent dispersal distance.
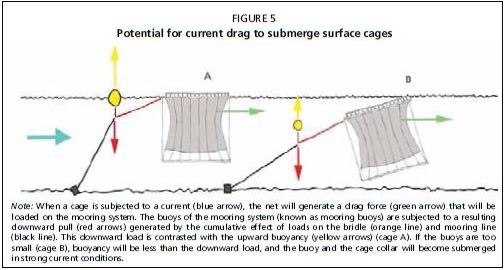
Current speed needs to be considered when designing the cage mooring system. Compensator buoys are sized according to the expected speed of the current registered on the site (Figure 5), as well as the dimensions of each of the components making up a mooring system. The net generates very strong drag forces because of the large area. When a net is heavily fouled, it can become an almost solid barrier to the current, increasing the load borne by the mooring system and potentially exceeding its weight- bearing limit.
Optimal current speed varies according to the cultured species and the mesh size of the cage nets. In the Mediterranean Sea the optimal current speed in cage- aquaculture is generally between 10-20 cm/s and not exceeding 60 cm/s. In salmon aquaculture 25-50 cm/s is the optimal current speed and 75 cm/s is the maximum speed recommended. The Norwegian Standards NS9415 requires 50 cm/s as minimum input for determining the size of the mooring system and the elements to be used.
The prevailing direction of the current should also be consider ed, because this determines the area of effluent waste dispersal. A correctly sited farm will consider the location of sensitive habitats with respect to the site and current directions.
Data on currents is usually published in thematic nautical charts, and/or made available by marine authorities (e.g. navy, coastguard, ministry for merchant navy). In addition, a current buoy deployment (e.g. Nortec Doppler profiler) is highly recommended for each site to obtain site-specific details and to validate the chart data. Current data can be collected for a couple of moon cycles and then extrapolated for a 50 years return period.
FIGURE 5
Potential for current drag to submerge surface cages
Wind
Wind accounts for approximately 5–10 percent of the total forces on a cage mooring system, while the share increases in case of feeding barges. Wind can have a direct impact on cages and their activity by generating pull on the jump net, disturbing vessels moving around the farm and dispersing the feed pellets outside the cages.
For example, a plastic circular cage of 30 m diameter with a 1 m high jump net has an approximate wind-exposed surface area of 40 m2. In a 40 knot wind, a single such cage can be subjected to 5 tonnes of wind pressure (R. Turner, Seawork Ltd, personal communication).
Wind can also have an indirect impact on cages, through wind-driven currents and wind-generated waves.
Data on wind are usually available at the relevant climate authorities, and can be analysed and summarized on a “wind rose” (see Figure 6). The wind rose is a graphical tool where statistical wind data records are reported at a particular location. It provides information on speed, direction and occurrence of the observed wind.
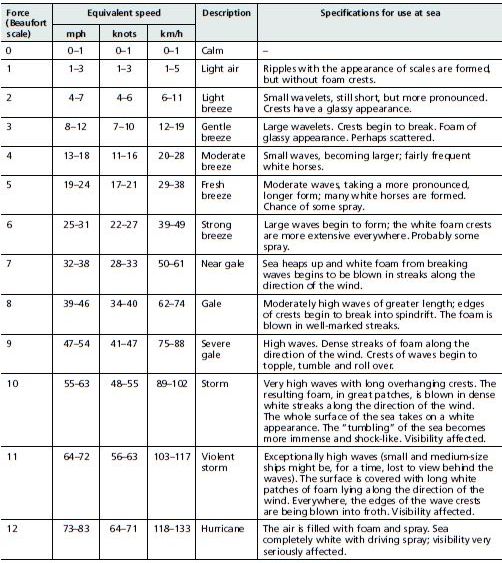
Wind is usually measured in knots, miles per hour (mph), or kilometres per hour (km/h) but a classification often used is the Beaufort Scale (Table 6), where a scale from 1 to 12 represents a range of possible wind force and subsequent sea conditions.
FIGURE 6
The wind rose represents the historical observations of wind at a specific location
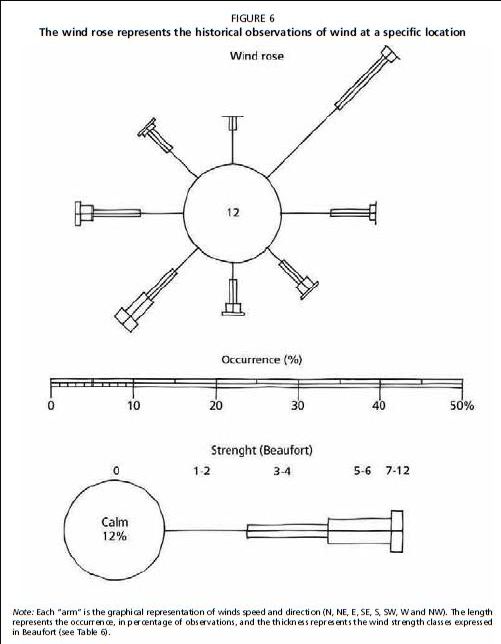
TABLE 6
Beaufort scale values and descriptions
Source: Kemp, 2011.
Waves
Waves account for approximately 20-25 percent of the total forces affecting the mooring and the equipment on a typical mid-size cage farm (3 000-4 000 tonnes/fish/year). Five factors influence the formation of wind-generated waves:
wind speed;
? fetch distance (open water over which the wind has blown); ? fetch width;
time duration the wind has blown over a given area; • water depth.
All of these factors work together to determine the size of waves. The greater each of the variables is, the larger the waves are (apart for depth, as explained below). Currents also indirectly influence the wave formation, as winds against currents generate shorter and steeper waves.
Wave measurements and characteristics (Figure 7):
? wave height: measured from trough to crest (metres);
? wavelength: measured from the crests between two consecutive waves (metres);
wave period: the interval between the arrival times of consecutive crests at a stationary point (seconds);
wave propagation direction: the direction of wave propagation measured in degrees from true North (0°), increasing in a clockwise direction.
The movement of waves across the sea surface in the deep ocean results in almost circular-shaped motions of water particles, called orbitals (Figure 8). Below the surface, orbitals gradually diminish with depth, up to a depth of half of a wave's length above which orbitals are not present. When waves approach the shore and the depth become lower that the half of the length of the waves, orbitals may reach the bottom. Friction between the bottom and the orbital's motion dissipates wave energy. The amount of dissipation depends primarily on orbital velocity and the rough quality of the sea bed. When the orbitals of a wave reach the bottom, the wave becomes steeper and eventually folds over as a breaking wave and surf. These bottom effects on waves are why waves have a greater steepness and become more destructive closer to shore.
The characteristic height of waves over a period is usually expressed as significant wave height (SWH or Hs), expressed in metres. Hs x 1.9 gives the maximum wave height over the period.
Given the measurement of the height of a given pool of waves, Figure 9 represents an average height (trough to crest) of the highest one-third of the waves in a given period (usually chosen in the range from 20 minutes to 12 hours).
FIGURE 7
Wave crest, trough and length
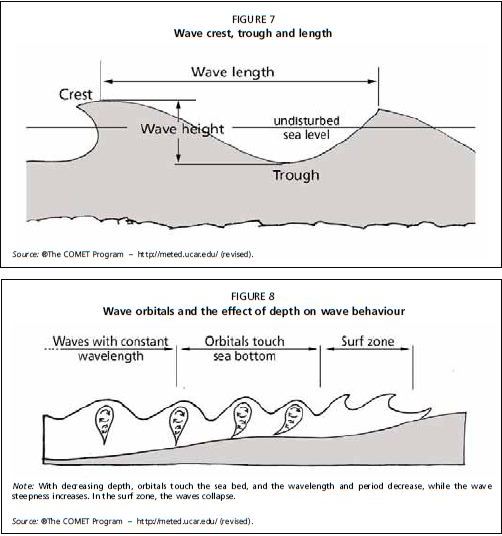
FIGURE 9
Statistical wave distribution in a given period
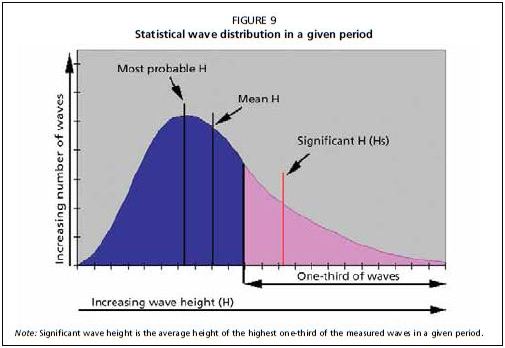
Note: Significant wave height is the average height of the highest one-third of the measured waves in a given period.
Other parameters for wave measurement are:
• Dominant wave period, in seconds, is the period between waves with maximum energy. In a given period, it is the time between the higher-energy waves.
• Average wave period, in seconds, of all waves during a 20-minute period.
The direction from which the waves of the dominant wave period are coming. The units are degrees from true North, increasing in a clockwise direction, with North as 0 (zero) degrees and East as 90 degrees.
Fetch is the distance over which the wind blows in a constant direction and at a constant speed. While wind speed is the ultimate limiting factor of wave growth, growth is also limited by the size of the fetch region. Fetch size is constrained primarily by land masses.
There are smaller generated waves that are created out from the sides of the fetch region, while the predominant wind direction generates larger waves that spread out from the downwind end of the fetch.
In a selected site area, the fetch can therefore be quantified by degrees and length of the fetch, which is the distance of the site from the next coastline.
In particular there are two different fetch definitions:
geographic fetch: the length of water over which a given wind might have blown; ? effective fetch: the length of area over which a given wind has actually blown. Example of the connection between waves, wind and fetch length are given in Table 7.
TABLE 7
Example of calculated significant wave period and peak period in varying wind velocities and effective fetch length

Source: Standards Norway, 2009.
Sea bed
Sea-bed characteristics should be surveyed in order to classify the sediment type for anchor embedment and to identify benthic communities.
This information will be crucial in evaluating the following:
? Mooring system:
- Anchor type
whether drag embedment anchors ("plough" or "spade" anchors) or deadweight anchors (concrete blocks) are used will depend on the sea-bed characteristics.
Possible mooring abrasion points in many cases, in order to maintain at necessary elasticity of the cage structure within the mooring system, for a potentially high wave climate, mooring lines longer than three/four times the site depth are required. Downstream mooring lines (or those on the side not exposed to the prevalent wind current or wave drag forces) may become very slack during storm or current action on the cages, and sink to where they rest on the sea bed. Although mud does not cause significant damage, sand or rocky areas in contact with the mooring lines can rapidly abrade them to a dangerous level. The use of non-compressible floats, secured to the lower end of the rope, or protected hard steel thimbles (tube-type thimbles; see Plate 10) for splices, can reduce this risk and lower maintenance costs.
- Anchor deployment zones - irregularities in the sea bed may require a precise selection of suitable anchor deployment points, to a void deployment of plough anchors on rocks (where the anchors will not embed) or of concrete blocks on hard clay (where the blocks may be dragged across the slippery surfaces).
• Sensitive habitats (live corals, seagrass meadows, nursery sites, etc.) should also be individually identified and mapped. The farm should be located downstream. from these habitats, taking into account the current's prevailing direction. As a good anchor embeds itself deeply into the sea bed, it is important to know more about the sea bottom than just its upper layer. Shells, weed and seagrass might prevent an anchor from taking hold. However, once through the upper layer, the anchor can dig itself into the lower sandy, mud, peat, cobble, stony or clay bottom layers, each with different holding characteristics. Common sea-bed compositions are usually reported in marine charts, using letters as symbols to indicate the type of sea bed. Table 8 provides a list of possible sea-bed compositions alongside the appropriate symbol used in the marine charts.
Thick mud, clay and sand will provide good holding, as will pebbles. Rocky, stones, corals will require a deadweight (gravity) anchor (i.e. concrete block).
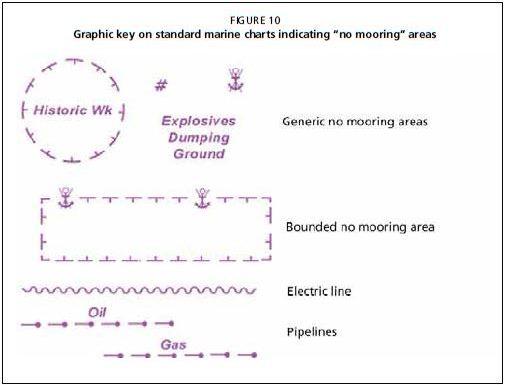
The sea bed might be unusable for anchorage, or anchoring may be forbidden for reasons other than sea-bed nature, such as the presence of cables, telephone lines or pipelines, explosive dumping areas, or historical shipwreck sites (Figure 10). These limitations should be indicated on the nautical chart or enquiries can be made to the coastguard on this issue.
TABLE 8
Symbols used in standard nautical charts to indicate sea-bed composition
FIGURE 10
Graphic key on standard marine charts indicating “no mooring” areas
Storm and hurricane incidence
Storms and hurricanes, or cyclones or typhoons, are meteorological phenomena that can represent a risk mainly for the strong winds and for the resultant waves and currents generated in the sea. They mostly occur in the tropical-equatorial zones, in the area delimited by the two tropics, but they can extend their incidence into the North Atlantic (United States of Amercia and Canada) as well as the North Pacific, mainly on the eastern coast of Asia (China and Japan).
Hurricanes are classified with the Saffir-Simson hurricane wind scale (Table 9).
TABLE 9
Saffir-Simson hurricane wind scale

Source: Saffir, 1973.
The occurrence of hurricanes in a selected area should be carefully evaluated in order to perform an accurate siting and an adequate mooring calculation if the likelihood of having these phenomena is considered high.
Different cage models, other than floating, may be considered in the areas where there is a high incidence of hurricanes, such as submersible cages that are more suitable for extreme weather conditions.
Other criteria
Logistics
The distance between the farm site and needed land facilities directly affects running costs. An excessive distance will imply:
? higher transfer times, and therefore less time for working on the farm;
? higher fuel costs;
greater risks during fingerling transportation.
Distance can represent a limiting factor if an emergency occurs on the farm, e.g. in the case of accidents or damage to the nets. The time needed to respond should be as short as possible, and distance may represent a limiting factor.
Available infrastructures at cage-site locations should be identified in order to evaluate possible advantages or disadvantages connected to the site's position. These may include:
? roads;
piers/harbours/jetties;
? available work space on land;
? storage or warehouse availability.
Other coastal uses
The use of coastlines, activities carried out on them or the different occupations of those working on the coast should be considered in order to minimize the risk of negative interactions occurring with other coastal users in performing cage-farming duties. Such areas include:
port areas or infrastructures;
? dumping points and underwater outlets along the coast;
? areas of interests for tourism (residential, beaches);
archaeological sites;
traditional fishing areas; artificial reefs;
other aquaculture facilities; ? areas of military interest.