6.5.2 Effect of ration on growth
The ration given in sections 6.3 and 6.4 for the purposes of explanation of spat culture methodology is 0.4 mg dry weight of algae per mg live weight of spat per week (R 0.4). It has proved to be a practical ration in hatcheries because it is not excessive in terms of algal food production requirements and it is adequate in providing satisfactory growth rates of most species.
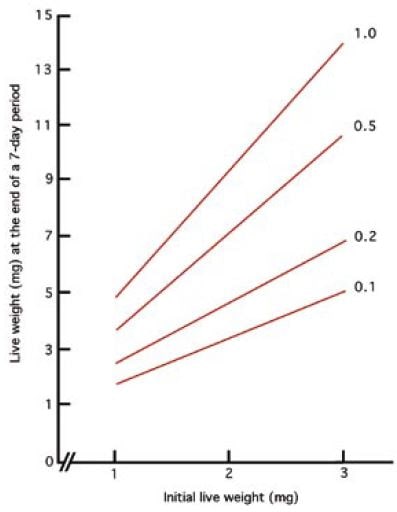
Better growth rates can be achieved by feeding higher rations. As an example, the growth of Pacific oyster spat is given in Figure 99 when experimentally fed rations ranging from R 0.1 to R 1.0 at a mean temperature of 24oC. The graph shows growth in a 7-day period for spat of different mean live weights at the beginning of the week. Clearly, growth continues to increase when spat are provided with higher rations than R 0.4. Spat of 2 mg at the beginning of a week will reach almost 7 mg by the end of the week when fed R 0.5 and 9 mg when fed R 1.0.

Figure 99: The relationship between food ration and growth for Pacific oyster spat.

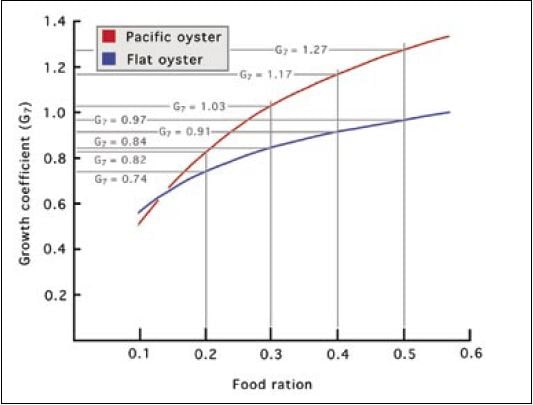
Figure 100: Comparison of the growth of European flat oyster and Pacific oyster spat at 24oC when fed various rations of a mixed diet of Isochrysis and Tetraselmis.
Among the oysters cultured in hatcheries, the various Crassostrea species respond very similarly in terms of growth rates for given rations. Spat of the European flat oyster, Ostrea edulis, do not grow quite as rapidly when provided the same conditions. Comparative growth in live weight of European and Pacific oysters is shown as the growth coefficient G7 when fed rations ranging from R 0.1 to R 0.5 at 24oC in Figure 100. G7 is calculated from the following equation:
G7 = ln wt7 – ln wt1
where wt7 is the mean live weight of spat at the end of a 7-day period and wt1 is the mean live weight at the beginning of the period (ln denotes natural logarithm).
The size spat will grow to at the end of a week when they begin the week at a specified size can be calculated from the equation. Growth coefficients are marked on the graph for both species when fed the same rations per unit live weight biomass. What this means for spat of both species when they begin a week at 2 mg mean live weight is shown in Table 15. Spat at least doubled their weight by the end of the week on all rations and Pacific oyster spat more than trebled their weight on rations R 0.4 and R 0.5.
Table 15: Mean live weight of Ostrea edulis and Crassostrea gigas spat at the end of a 7-day period when beginning the week at an initial mean live weight of 2 mg and fed rations ranging from R 0.2 to R 0.5 at 24oC. Ration is as dry weight of algae (mg) per mg live weight of spat per week. The diet was Isochrysis and Tetraselmis in a 50:50 ratio by dry weight.
