The status of global aquaculture and fisheries
Capture-based aquaculture is receiving particular attention in maritime nations world-wide. The system, though it is an overlap between fishery and aquaculture that exploits the same resources, also has its own specific characteristics. The result is an atypical system that interacts with fisheries and aquaculture. It is thus necessary to assess trends in fisheries and aquaculture, in order to obtain a better overview of the resource status, and to assess the positive and negative interactions that could arise from this aquaculture practice.
Resource exploitation (whether in the activity concerns larval, juvenile or adult stages) must fall in line with responsible and sustainable aquaculture and fishing policies. Responsibilities must be shared by fishermen, farmers, researchers, institutions, and administrations, at national and regional levels, as stated in Code of Conduct for Responsible Fisheries (FAO 1995). Careful use of resources is a fundamentally important aspect of “sustainable development”, which is defined as “the management and conservation of natural resources and the orientation of technological and institutional change in such a manner as to ensure the attainment and continued satisfaction of human needs for present and future generations” (FAO 1997b). Policy and decision-makers increasingly have to consider a holistic approach towards fisheries management decisions and aquaculture policy development: this is fundamental to sustainable development in the whole fisheries sector. Global demand for fish is increasing and the enforcement of national and regional legislation to protect dwindling resources is essential.
Landings from the global fisheries were 62.8 million tonnes in 1970 and 67.7 million tonnes in 1980 (FAO 2002a). By 1990, they had risen to 85.5 million tonnes. Since 1994, they have become generally stable at 90-95 million tonnes (FAO 2002b), while the production of foodfish through aquaculture showed an increase for the same period, from 20.8 million tonnes in 1994 to 35.6 million tonnes in 2000 (FAO 2002a). For this reason, many people rely on aquaculture expansion to relieve the pressure on fish stocks and supply increasing consumer demand.
¦ Trends in global fisheries
In 2000, global capture fisheries harvested nearly 95 million tonnes (FAO 2002b) from marine areas and inland waters, with the Asian region contributing approximately 42 percent of total landings, followed by South America with 19 per cent and Europe with 16 percent. Global capture fisheries contributed 72 per cent of the total fishery production of 130 million tonnes.
The Northwest Pacific, with 23 million tonnes, had the largest reported landings from marine fisheries in 2000, followed by the Southeast Pacific and the Northeast Atlantic regions (FAO 2002b). Production in the Northwest Pacific remained almost steady between 1996 and 2000. Total production in the Southeast Pacific increased from 14 million tonnes in 1999 to 16 million tonnes in 2000, but was still much lower than the 20.3 million tonnes recorded in 1994. Production in the Northeast Atlantic remained very stable between 1994 and 2000. In the other marine fishing areas, production has also remained relatively stable since 1994. Figure 1 shows the major sources of global capture fisheries production in 2000, as defined by FAO fisheries area.
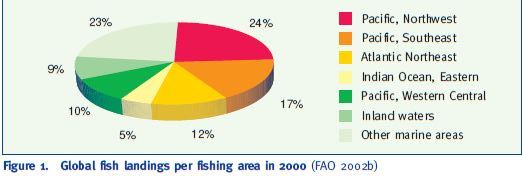
Figure 1. Global fish landings per fishing area in 2000 (FAO 2002b)
In 2000, China was the leading producing country (17.0 million tonnes) followed by Peru (10.7 million tonnes), Japan (5.0 million tonnes), the United States (4.8 million tonnes), Chile (4.3 million tonnes), Indonesia (4.1 million tonnes), the Russian Federation (4.0 million tonnes), India (3.6 million tonnes), Thailand (2.9 million tonnes) and Norway (2.7 million tonnes). These ten countries accounted for 63 percent of the entire 2000 capture fisheries production by volume (Figure 2).
Figure 3 shows the general trend in global capture fisheries landings from 1991 to 2000 (Table 1). From 1991 to 2000 the average growth rate for capture fisheries production was very small (1.3%). Most of this was due to increases in production from inland waters (3.9%); average annual expansion in marine areas was much smaller (1.1%).
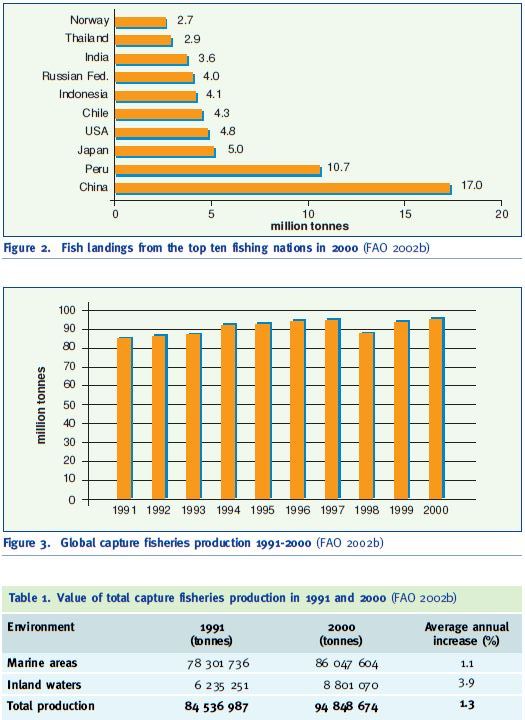
Figure 2. Fish landings from the top ten fishing nations in 2000 (FAO 2002b)
Figure 3. Global capture fisheries production 1991-2000 (FAO 2002b) Table 1. Value of total capture fisheries production in 1991 and 2000 (FAO 2002b)
In addition to the marine capture fisheries output that appears in statistical returns, a large quantity of the catch is discarded at sea because it consists of unsuitable species or sizes for marketing. James (1995) estimated that discards may amount to some 27 million tonnes annually. If this level of discards has continued, the total capture fisheries harvest may have been close to 122 million tonnes in 2000. Not all capture fisheries production is used for human consumption. 33.7 million tonnes was used for other purposes, mainly fishmeal and fish oil production in 2000 (FAO 2002d). Thus the capture fisheries yielded 61.1 million tonnes of foodfish (fish destined for human consumption) in that year, while aquaculture provided another 35.6 million tonnes (FAO 2002a). Aquaculture therefore contributed about 37 percent of the global foodfish supply in 2000.
Marine fish contributed 71.8 million tonnes to capture fisheries production in 2000, while the catches of diadromous and freshwater fish were 1.8 million tonnes and 6.9 million tonnes respectively. To date, there are some 25 000 different known fish species, of which 15 000 are marine (Nelson 1994). However, 75 percent of the world’s marine fishes landings come from only 200 species (~1 %). More than 2 500 species of reef-fish inhabit the Indonesian and Philippine region, and 35 percent of the world fish species are found in Indonesia alone. These biologically important areas are now being seriously threatened by the Live-Reef Food Fish Trade (LRFFT). The depletion of reef stocks in Southeast Asia has resulted in growing pressure on the resources of adjacent regions, especially the islands of the South Pacific (The Nature Conservancy 2002).
Fishery resources in general are heavily exploited. Recently it has been reported (FAO 2002c) that only 25 percent of the major marine fish stocks or species groups for which information is available are under exploited or moderately exploited. About 47 percent are fully exploited and 18 percent overexploited; the remaining 10 percent of stocks are significantly depleted. The worst affected stocks are in the Atlantic, the Central East and Northeast Pacific, the Black Sea and the Mediterranean (FAO 2000).
In 2000 (Figure 4), the Asian region contributed 48 percent of global fisheries production in marine and inland areas (45.4 million tonnes), followed by South America (18.0 million tonnes) and by Europe (16.0 million tonnes).
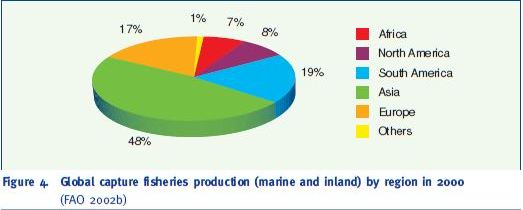
Figure 4. Global capture fisheries production (marine and inland) by region in 2000 (FAO 2002b)
There appears to be little likelihood that global fisheries can increase production, and it is likely that there will be a gradual fall over the following decades. There will also be increasing pressure on high value stocks, with the inherent risk of overfishing or unreported fishing, leading to a reduction in recruitment to these valuable resources. More closures of fisheries seem inevitable, resulting in a loss of income and traditional livelihoods for coastal communities. With the demand for fish products set to increase, only aquaculture can fill the gap between demand and supply, and has the potential to replace incomes lost from fishing.
¦ Trends in global aquaculture
In 2000, global aquaculture production of foodfish (fish, crustaceans and molluscs) totalled 35.6 million tonnes, valued at nearly US$ 51 billion (FAO 2002a). Asian aquaculture farmers contributed 89 percent of the production valued at US$ 40.8 billion (80 percent of the total value). Asia thus appears to completely dominate aquaculture production (Figure 5). However, this does not mean that aquaculture in the rest of the world is unimportant. Figure 6 shows the proportion of aquaculture output produced in other continents.
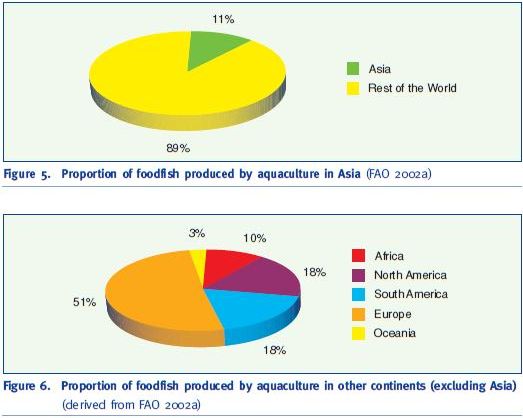
Figure 5. Proportion of foodfish produced by aquaculture in Asia (FAO 2002a)
Figure 6. Proportion of foodfish produced by aquaculture in other continents (excluding Asia) (derived from FAO 2002a)
In 2000, nearly 84 percent of total aquaculture yield (including aquatic plants) was produced in low-income food-deficit countries (LIFDCs); China is dominant, with 32 million tonnes. However, when aquatic plants are excluded, only four of the top ten aquaculture producers of foodfish (China, India, Indonesia, Bangladesh) are LIFDCs (Figure 7). This in no way belittles the importance of aquaculture in other LIFDCs with a lower production than the top ten.
Global production of foodfish through aquaculture (Figure 8) has increased from 4.7 million tonnes in 1980 and 13.1 million tonnes in 1990 to 35.6 million tonnes in 2000 (FAO 2002a).
Global aquaculture production of foodfish was valued at nearly US$ 50.9 billion in 2000 (Figure 9). The value of the sector’s foodfish production grew at an annual average of nearly 8 percent between 1991-2000.
So far, farming in freshwater has dominated foodfish production through aquaculture (FAO 2002a). However, the proportion grown in marine waters is increasing (32 percent in 1991; 36 percent in 2000). In addition, because of its greater average unit value, foodfish reared in marine
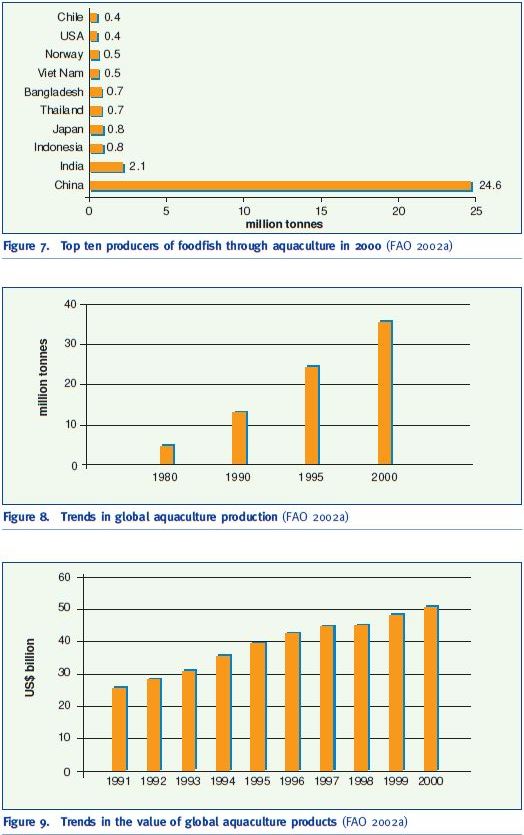
Figure 7. Top ten producers of foodfish through aquaculture in 2000 (FAO 2002a)40
Figure 8. Trends in global aquaculture production (FAO 2002a)
Figure 9. Trends in the value of global aquaculture products (FAO 2002a)
and brackishwater represents a higher proportion of the global total value of aquaculture than in freshwater (54 percent in 1991; 51 percent in 2000). In 2000, 81 percent of the total foodfish production from marine and brackishwater was reared in Asia, while 11 percent was produced in Europe (Figure 10).
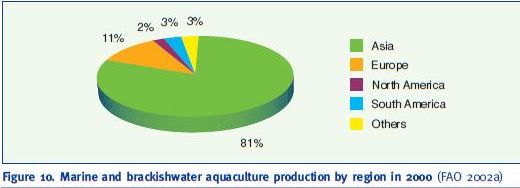
Figure 10. Marine and brackishwater aquaculture production by region in 2000 (FAO 2002a)
In marine and brackishwater areas, the most productive continent was Asia (12.2 million tonnes) and the highest production was in China (9.4 million tonnes). The top ten producing countries in these environments are shown in Figure 11.
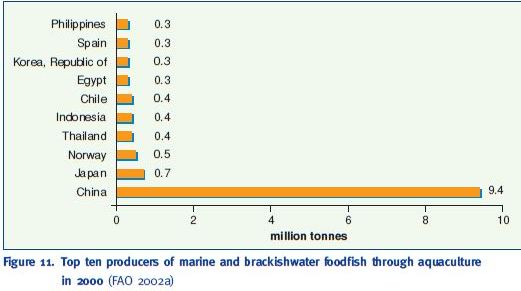
Figure 11. Top ten producers of marine and brackishwater foodfish through aquaculture in 2000 (FAO 2002a)
Between 1991 and 2000, the average annual rate of expansion in the production of foodfish in marine waters (12.6%) was greater than in any other environment (Table 2). In brackishwater, the annual expansion rate was very much less (4.2%). These rates of expansion are in marked contrast with the situation in the capture fisheries (Table 1).
Table 2. Global aquaculture production in 2000 compared to 1991 (FAO 2002a)

Global aquaculture has been in a dynamic phase of growth for more than 30 years. Its average annual expansion rate between 1970 and 2000 was 9.2 percent, compared to only 2.8 percent for terrestrial farmed meat production systems (FAO 2002c). This trend can be attributed to several key factors:
? the closure of the life cycles for important commercial species; e.g. salmon, seabass, seabream, penaeid shrimps, etc;
? the development of hatchery technology to supply on-growing units with juveniles outside of the normal availability seasons;
? the development of on-growing technology that can be used in exposed locations, in particular in offshore cages;
? the manufacture of specially formulated feeds which enhance production and maintain fish health;
? better understanding of fish biology and diseases, and the development of treatments for disease control; and
? the development of management systems that optimize production.
However, the sector still lacks the knowledge and experience to market the production now being achieved successfully. All the species that have been commercialized have suffered from price declines, due to the poor development of markets to absorb the new volumes now being produced. This problem is further aggravated by the fragmented nature of the sector, and the situation is unlikely to change until a more coordinated approach is adopted.
Capture-based farmers have, to a large degree, avoided this disjointed approach so far (2002). This is largely due to the fact that many operations are joint ventures and that they supply a common market with capture fisheries, e.g. supplying bluefin tuna to the Japanese market.
Good marketing strategies and response to consumer perceptions will be the most important issues to tackle if the industry is going to continue its rapid growth. The industry will also have to address the concerns of environmental campaigners, in order to avoid adverse market reactions.