4.1. Identification of areas suitable for aquaculture
Zone boundaries are initially based on hydrographical or hydrological parameters at a scale from a few to hundreds of kilometres, and are usually all or part of a contiguous waterbody or basin such as a fjord, tributary of a river or whole river system, a whole lake, a coastal bay, or an estuary or a semi-enclosed sea.
Geographies with the potential to become an aquaculture zone generally are those that have relatively few existing users, abundant water of a quality adequate for farmed species, have basic production infrastructure (e.g. electricity, roads) and access to input and output markets (including labour), and are not located near ecologically sensitive sites.
At the subnational, national or regional scales, it may only be possible to define in very general terms where aquaculture would most likely prosper. Remote sensing and geographic information systems (GIS) are excellent for this kind of work, and are useful tools to support stakeholder perceptions and insight.
Satellite images can show where human settlement and other important land uses could be expected to conflict with aquaculture development; for example, GIS-based flood-zone mapping is commonly used by insurance companies to identify areas prone to inundation and can also provide useful information on such risks.
At the zoning stage, some detail is needed to define good places for aquaculture. In this context, local knowledge, organized data collection, property maps and site visits should be used to focus stakeholder discussion on defining where boundaries for aquaculture zones should be located within the broader regions identified during the scoping exercise.
The fundamental factors that determine the viability of a zone for aquaculture are basic topography/bathymetry (i.e. available flat land or open water), temperature, current velocity, and water quantity and water quality (e.g. salinity, hardness). These determine the species that can be cultured efficiently in a particular area, and give a broad indication of the production system that is best suited. The larger the population, the greater the potential market for aquatic products and the availability of labour and services. Urban market centres are potential locations for on-processing and marketing of the fish. However, there are risks associated with urban centres, including theft and pollution.
Pre-existing aquaculture also has an influence on where new aquaculture should be placed. The presence of successful aquaculture sites is indicative of more general suitability, but should not be automatically assumed. The presence of critical infrastructure, such as roads, power facilities, feed mills, processing facilities and so on, also argue for clustering of aquaculture within zones. This must be balanced with the need to provide sufficient space so that effluents and disease from one farm cannot flow onto another and the carrying capacity of the local environment.
Table 7 outlines the main suitability criteria that apply to most aquaculture farming systems. The various criteria listed in Table 7 will each have their own degree of importance, and it is essential that these can be ranked or measured for specific locations, even if this can only be done crudely. It is also important to determine “thresholds” that pertain to a desired level of suitability for each criterion. The selection of the thresholds involves interpretation of the data selected, and such interpretation should be guided with literature research and opinions from experts and farmers. Thresholds will vary according to location, scale, environment, species and culture systems, and some of the thresholds may change over time. For example, species generally have an optimal range within which they will grow well, suboptimal ranges when stress is induced, and lethal levels above and below this, but will change only slowly or not at all. Social thresholds are likely to me more flexible, as these can change over time. In such cases, it is advisable to operate within optimal ranges where possible to ensure efficiency and cost effectiveness.
Knowledgeable technicians using the tools listed in Table 4 can identify zones with potential for aquaculture and provide advice on the most suitable species. There is also a myriad of published literature available on criteria for spatial planning and management of aquaculture, many examples of which can be found at:
• The GISFish Global Gateway to Geographic Information Systems, Remote Sensing and Mapping for Fisheries and Aquaculture (www.fao.org/fishery/gisfish).
• GIS and spatial analysis. GIS and remote sensing journal articles from the Institute of Aquaculture, University of Stirling, the United Kingdom of Great Britain and Northern Ireland (www.aqua.stir.ac.uk/GISAP/gis-group/journal-papers).
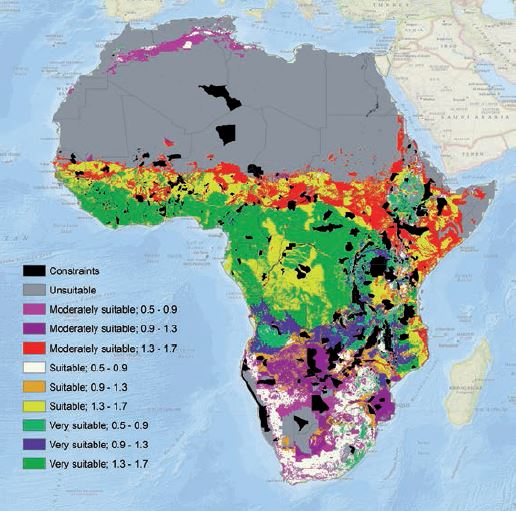
A good example of the use of GIS to identify potential aquaculture zones is an FAO study by Aguilar-Manjarrez and Nath (1998), who estimated inland fish farming potential at a continental scale. By overlaying the temperature regime, water availability, suitability of topography and soil texture, availability of agricultural by-products, local markets and road density on a map of Africa (Figure 2), they were able to identify in broad terms which areas on the African continent would be suitable for aquaculture.
While at this scale, it is not possible to identify exact locations for aquaculture zones, at the scoping stage this kind of information is useful to identify parks, deserts, flooded areas, cities and other major geographical features that would rule out aquaculture a priori.
FIGURE 2. Suitability for small-scale farming and potential yield (crops/year) of Nile tilapia in Africa

Source: Aguilar-Manjarrez and Nath (1998).